Categories in Dashboards are the pages within the application, which can be configured to hold charts or data tables.
Dashboards can be viewed on a number of different devices, from mobile phones and tablets to desktops and laptops.
To access the list of available categories, click the icon at the top left of the screen, highlighted below in red. You can only view one category (page) at a time.
 The category list slides in from the left side of the screen in a tree structure, with the parent category shown at the top and available sub-categories displayed beneath it.
You can open and close these by clicking the arrow beside each group. In the example below, Dashboarding is the group heading for several additional categories and subcategories. Clicking the arrow to the right of this category name opens or closes the list of available sub-categories.
The category list slides in from the left side of the screen in a tree structure, with the parent category shown at the top and available sub-categories displayed beneath it.
You can open and close these by clicking the arrow beside each group. In the example below, Dashboarding is the group heading for several additional categories and subcategories. Clicking the arrow to the right of this category name opens or closes the list of available sub-categories.
 Clicking the ‘Dashboarding’ heading displays the child categories beneath it.
Once you select a category, the list disappears from the screen again, maximising the amount of space available to view charts. The selected category is displayed in bold text, so you can quickly locate it in the list.
If you want the category list to be displayed permanently, you can pin the category slider on the left-hand side of the screen with the pin icon as shown below.
Clicking the ‘Dashboarding’ heading displays the child categories beneath it.
Once you select a category, the list disappears from the screen again, maximising the amount of space available to view charts. The selected category is displayed in bold text, so you can quickly locate it in the list.
If you want the category list to be displayed permanently, you can pin the category slider on the left-hand side of the screen with the pin icon as shown below.
If the category list is pinned, space on the category page is reduced slightly and cells move to the right to accommodate it. This may reduce the size of the charts, and as a result chart labels may be hidden if there is not enough space to display them in full.
 There is also a text box with a search function. If you start typing the name of a category, it displays all categories containing that string of text, even nested categories. There is no need to use wildcard symbols in your search.
In the example shown below, typing ‘ce’ in the search box shows all possible matches and their location within the category tree structure.
There is also a text box with a search function. If you start typing the name of a category, it displays all categories containing that string of text, even nested categories. There is no need to use wildcard symbols in your search.
In the example shown below, typing ‘ce’ in the search box shows all possible matches and their location within the category tree structure.
 In the example above, the filter shows ‘Insurance’, ‘Human Resources’ and ‘Dashboard User Access’ because they all contain the string ‘ce’.
The parent and child items are also shown in the list to aid navigation and add context.
 To close the category menu, either select a category or click anywhere on the dashboard page itself.
Interface navigation
The dashboard is designed to work using regular browser controls. If you move from one category to another, or drill up or down, you can navigate forwards and backwards using the browser controls. Similarly, you can refresh an entire page by refreshing the browser.
 The dashboard is entirely URL-driven, so you can bookmark, favourite, copy and send URLs in any way that suits you.
Bookmark/favourites
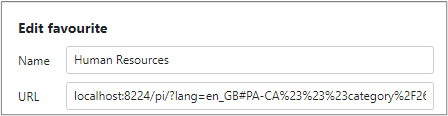
You can bookmark or favourite a category with filters applied in your web browser, just as you can with any other URL. This lets you immediately revisit this set of filters without having to reapply each filter again.
This option also allows you to create several tailored filters for each category, e.g., for your team or department, last week’s or last month’s data, or a certain product across a specific period.