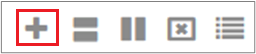
If the cell already contains a chart, you will need to click the ‘Chart Tools’ menu before clicking the ‘Create new chart’ icon. This will allow you to create a new chart from scratch and replace the one currently in that cell.
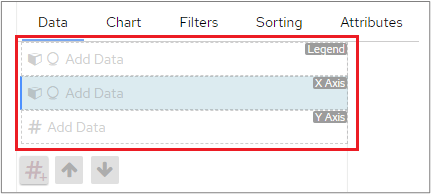
- Select the data that you want to use for a default Bar chart
- Choose the data that you want to use and then select a different type of chart on the Chart tab (note that data requirements may vary for different chart types)
- Choose the chart that you want to create on the Chart tab; this then shows you the appropriate objects for that chart type when you return to the Data tab