
Creating drill down levels
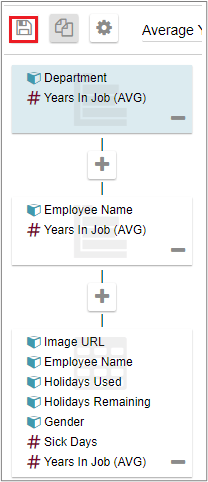
To create drill levels, click the Edit chart icon in the Chart tools menu on your chart. Click the Add icon, beneath the current chart information on the left-hand side of the screen.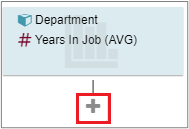
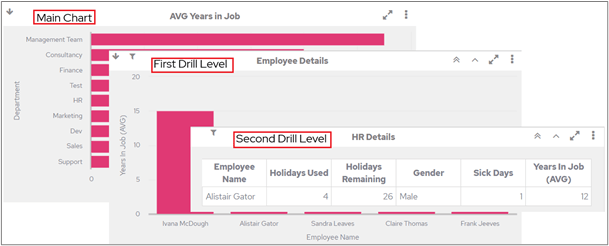
Viewing drill down levels
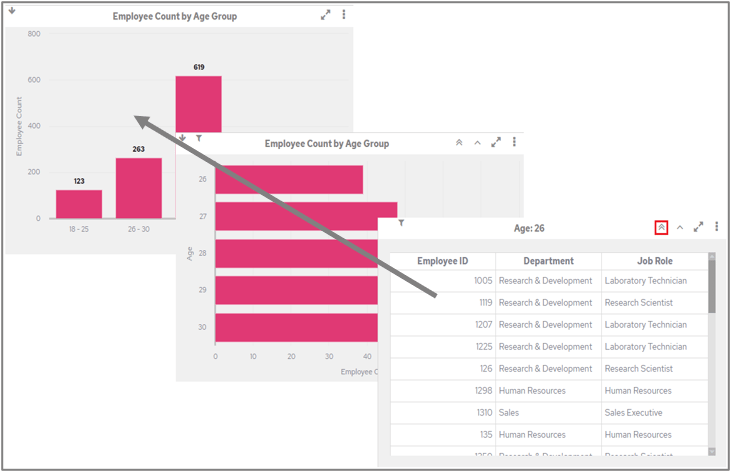
When drill down levels have been set up on a chart, a small downward-facing arrow is visible in the top-left corner of the chart cell. This indicates to a user that they can click one of the segments in the chart itself, for example one of the bars in a bar chart, to view further information relating to that segment only. The downward-facing arrow remains visible in the top-left corner of the chart cell until a user has drilled down to the last level.

If a user has sorted a table before drilling down from it, the sort order is retained when they drill back up to the previous level.
If a user has scrolled in a table before drilling down to a lower level, the scroll position is retained when they drill back to the previous level.
Returning to the top level
When a user has drilled down into underlying data on a chart, the two chevron icons at the top-right of the chart cell can be used to go back up through the levels. Once you have drilled down, you will see the following icons: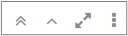
| Icon | Description |
|---|---|
| Click the double chevron icon to return to the highest level (main chart). | |
| Click the single chevron icon to go back one level at a time. |
Removing drill down levels
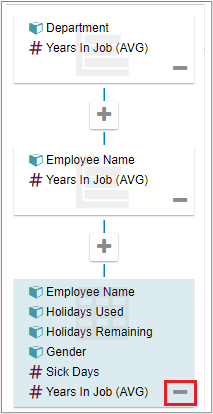
To remove a drill down level, click the Edit chart icon. In the Edit chart screen, click the remove icon next to the drill level that you want to remove.