Forms started, completed and overdue
This report totals how many forms were started, completed, and left overdue across your FlowForma environments over the last year. Use this report to get a quick overview of form activity at a point in time, for example, to identify how many forms are currently in progress, how many have been completed, or whether any processes have a large backlog of unfinished forms.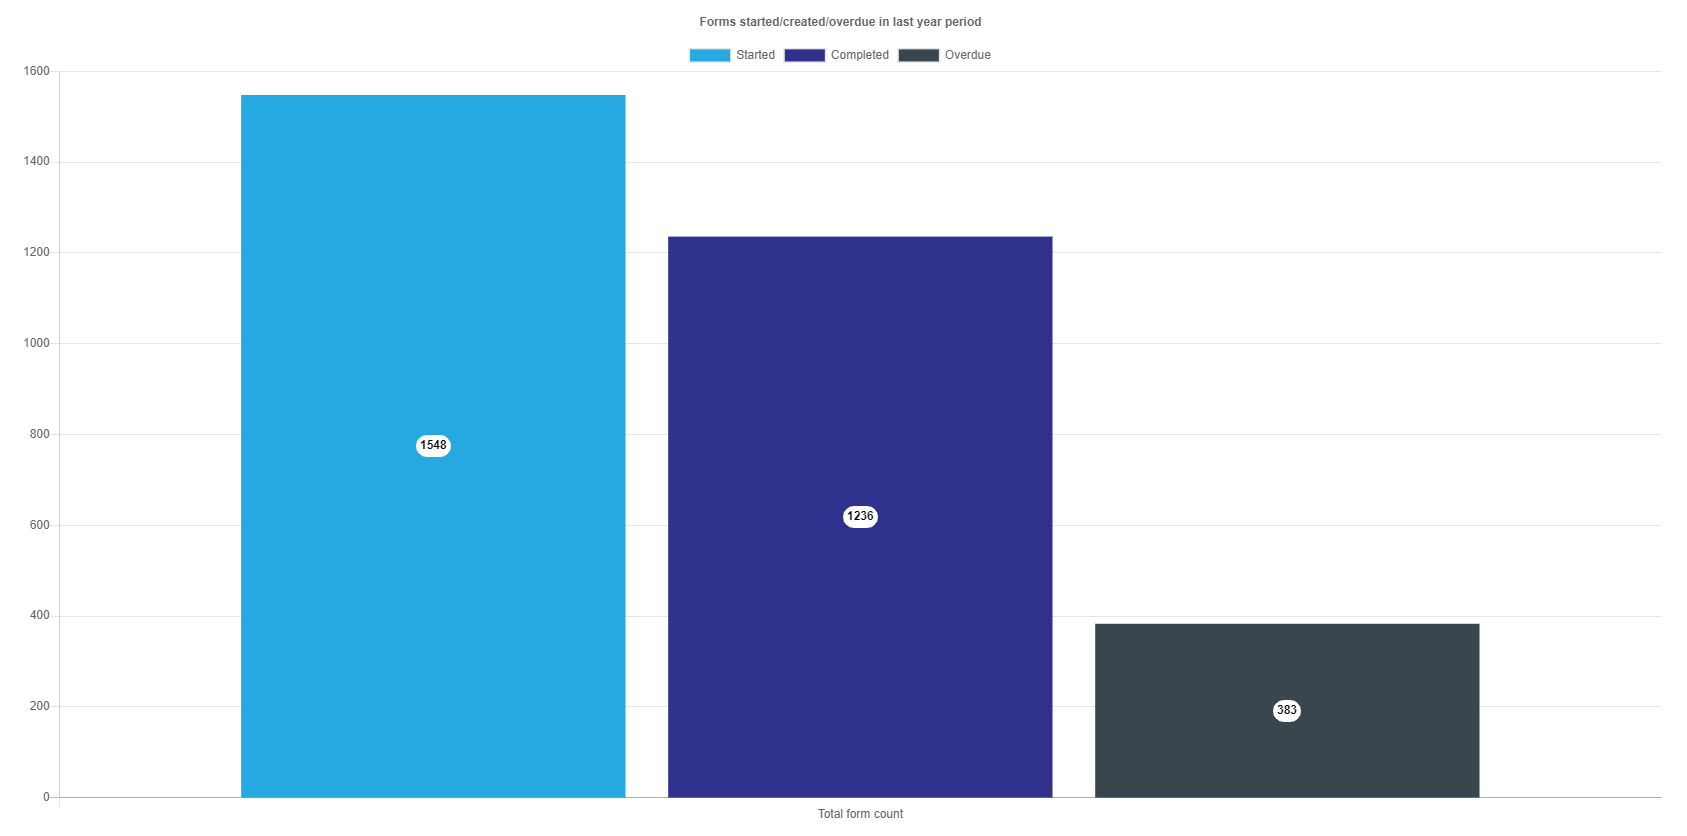
Forms started, completed and overdue by month
This report breaks the same started, completed, and overdue counts down by month, allowing you to spot trends in how your processes are being used over time. Use this report to understand whether process adoption is growing, to identify seasonal peaks in activity, or to report on usage over a specific period for governance and audit purposes.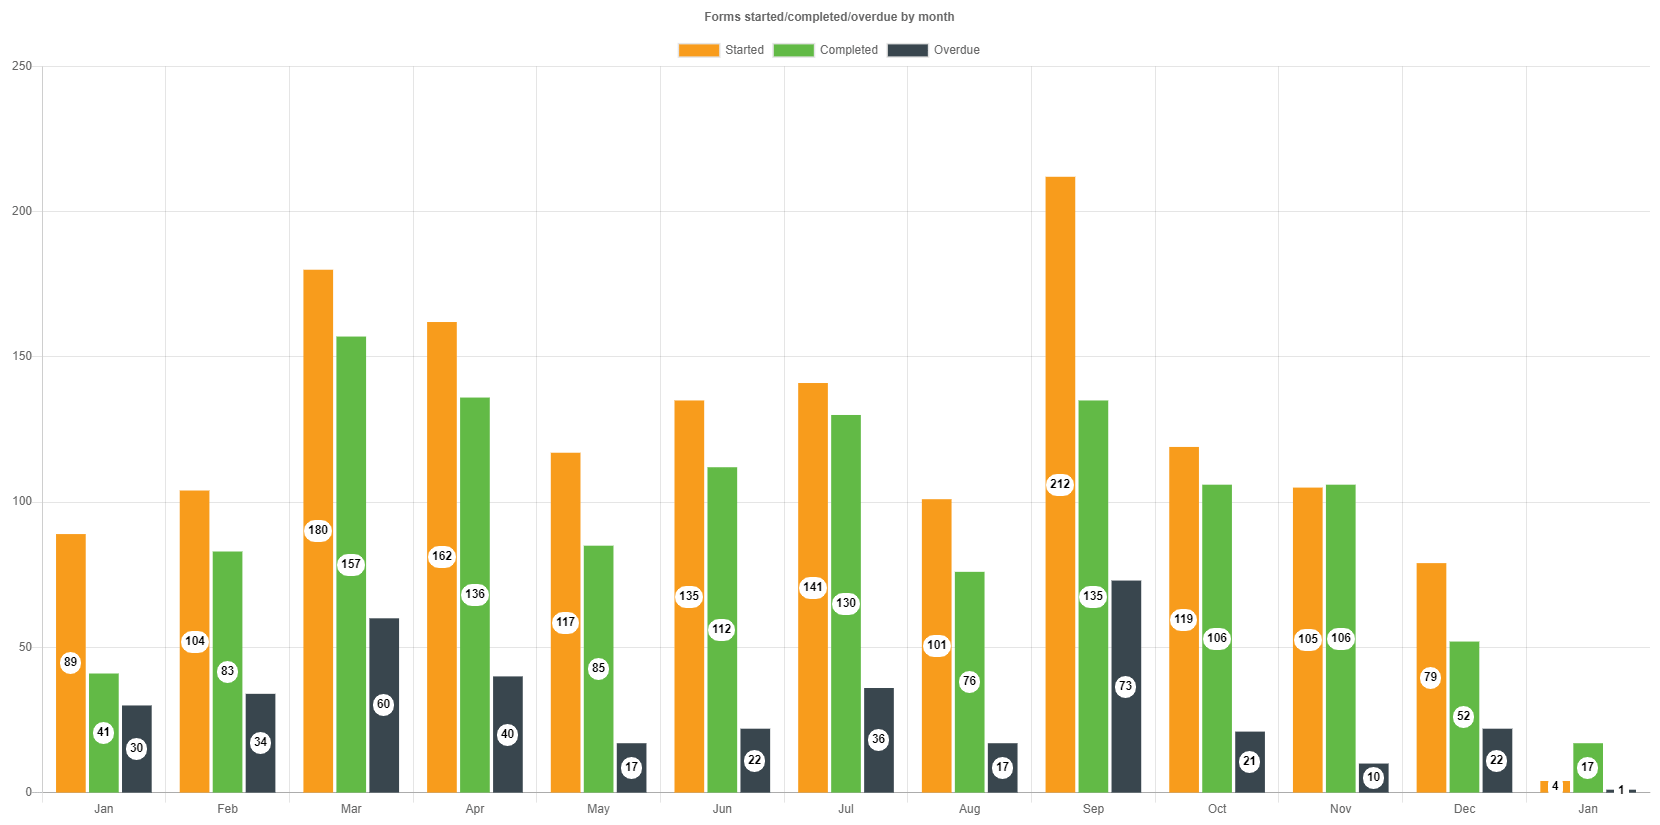
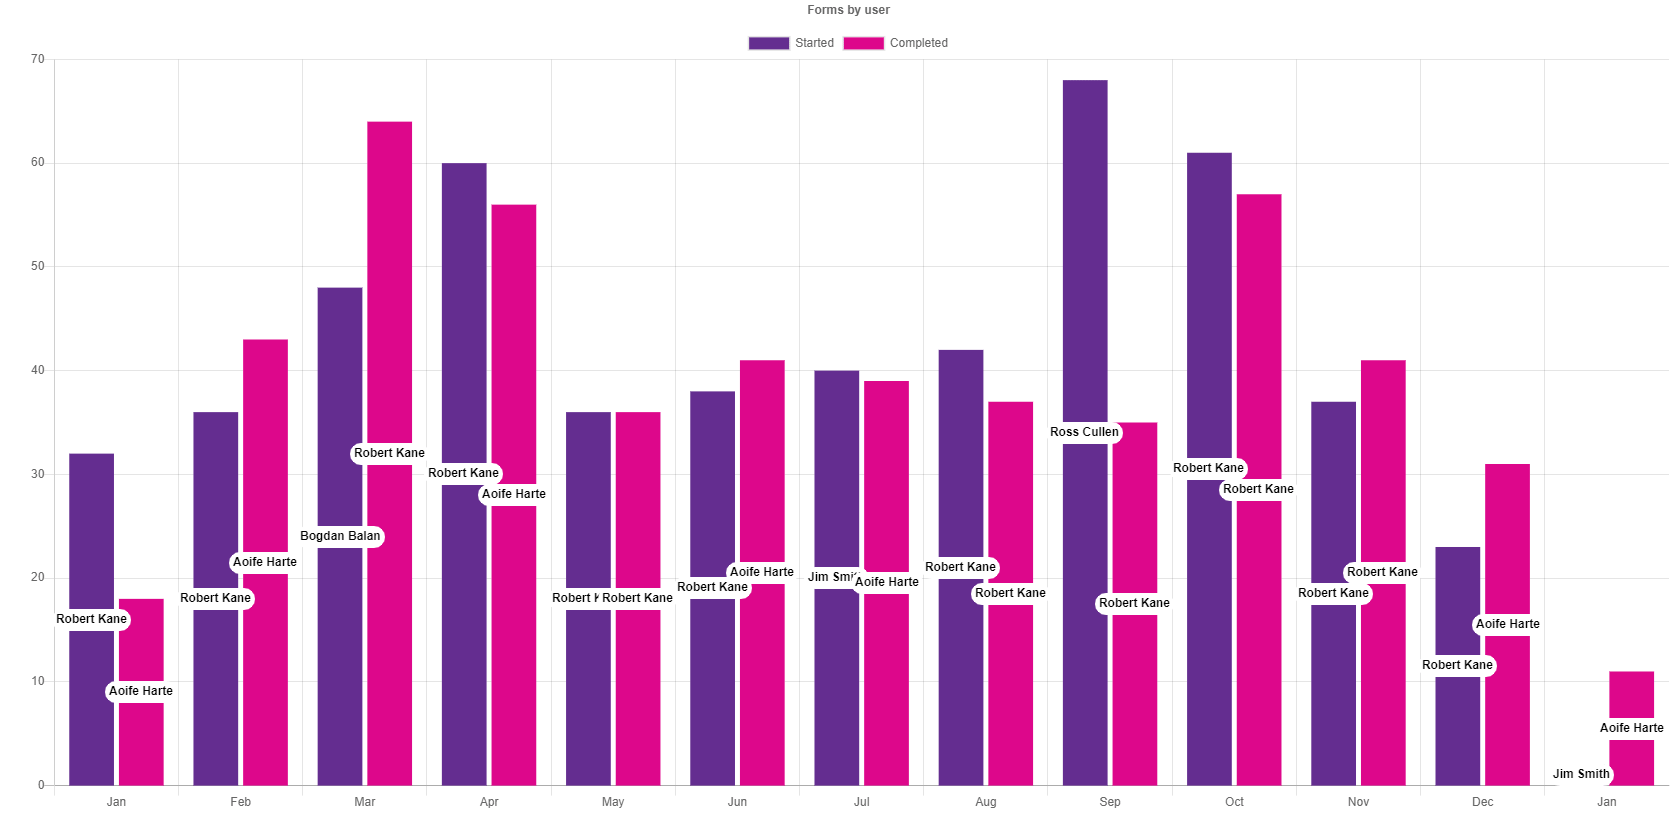
Forms by user
This report shows, by month, how many forms each user started and completed within your FlowForma environments. Use this report to understand which users are engaging most with your processes, to track adoption across the organisation, or to identify users who may need additional support or training.