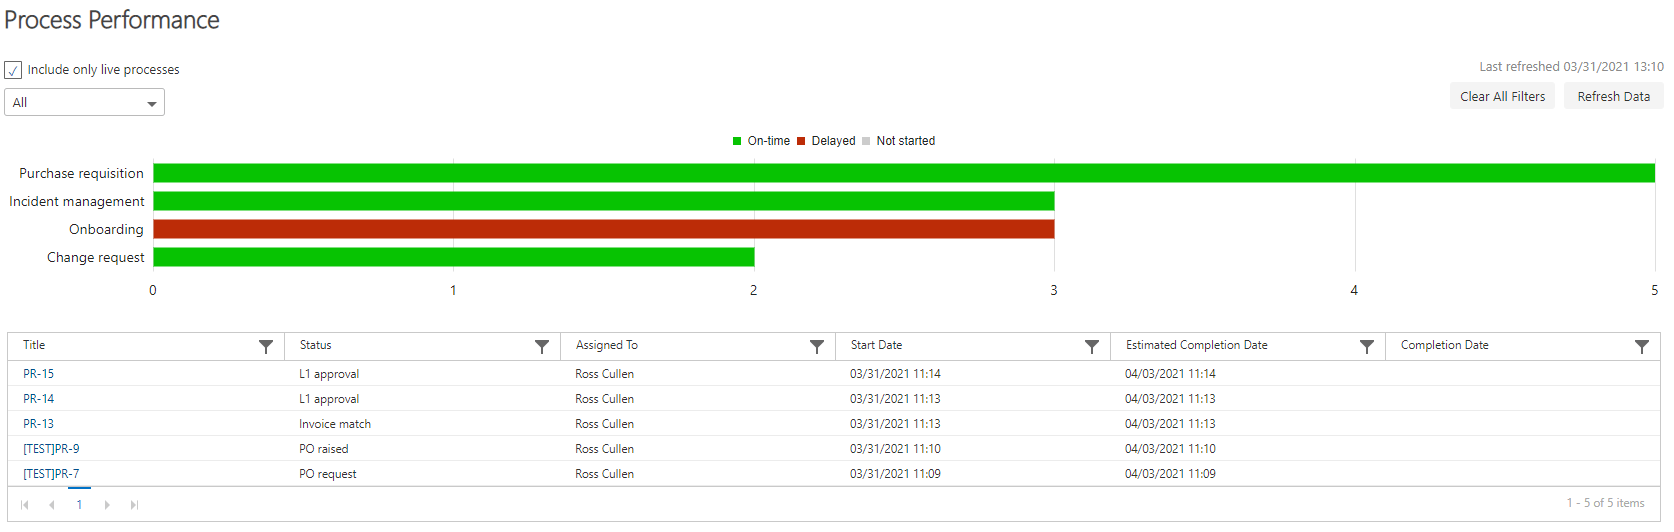
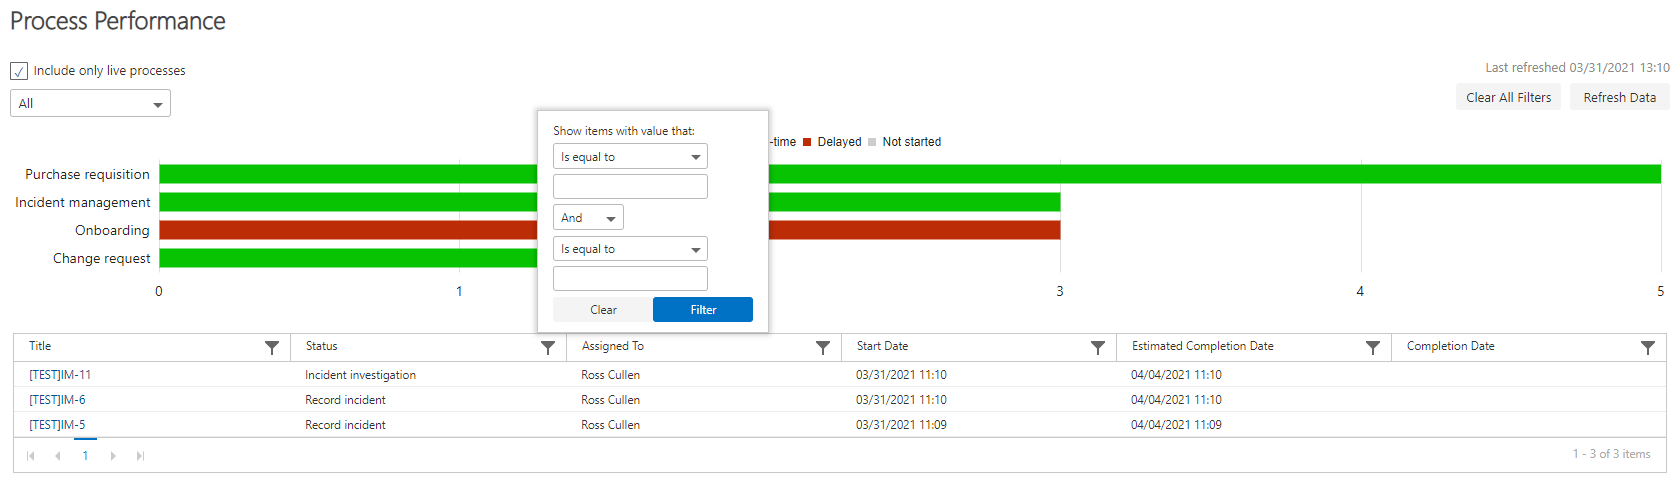
Process Performance provides insights into the performance of your processes by showing the status of forms and steps against their “time to complete” setting, and reporting on how many forms are on-time or delayed, and how many steps are on-time, delayed, or not started. You can access the Process Performance pages via the homepage, by clicking the icon on the top right. Process Performance icon on the homepage

Process performance

This page shows all flows added to the app, and displays a bar chart with the number of forms on each flow’s row, and the status of the form.
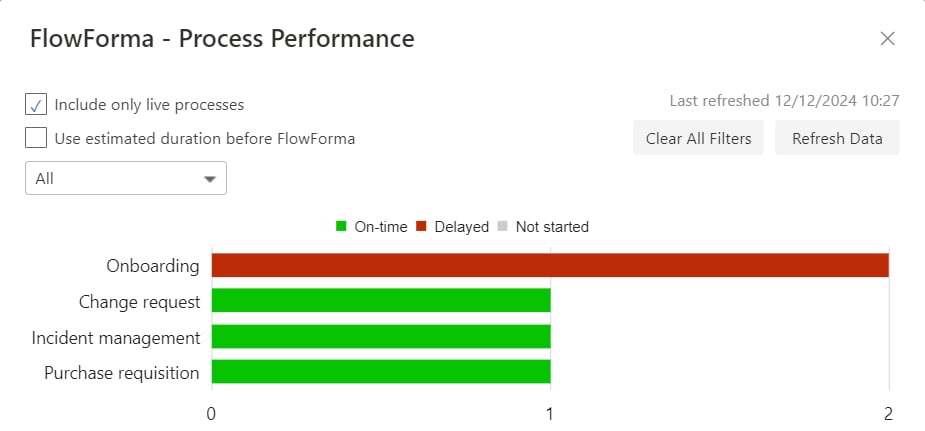
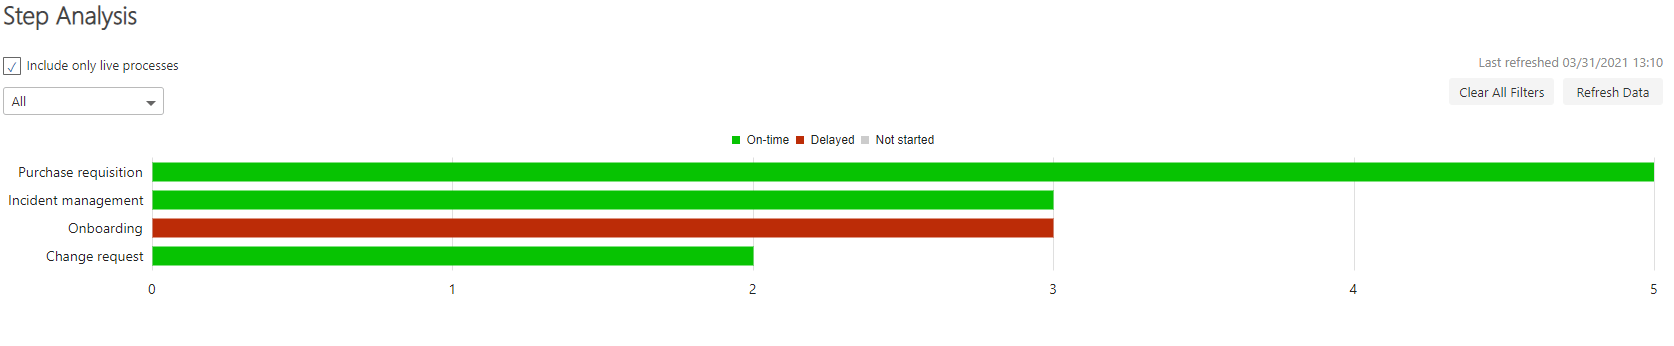
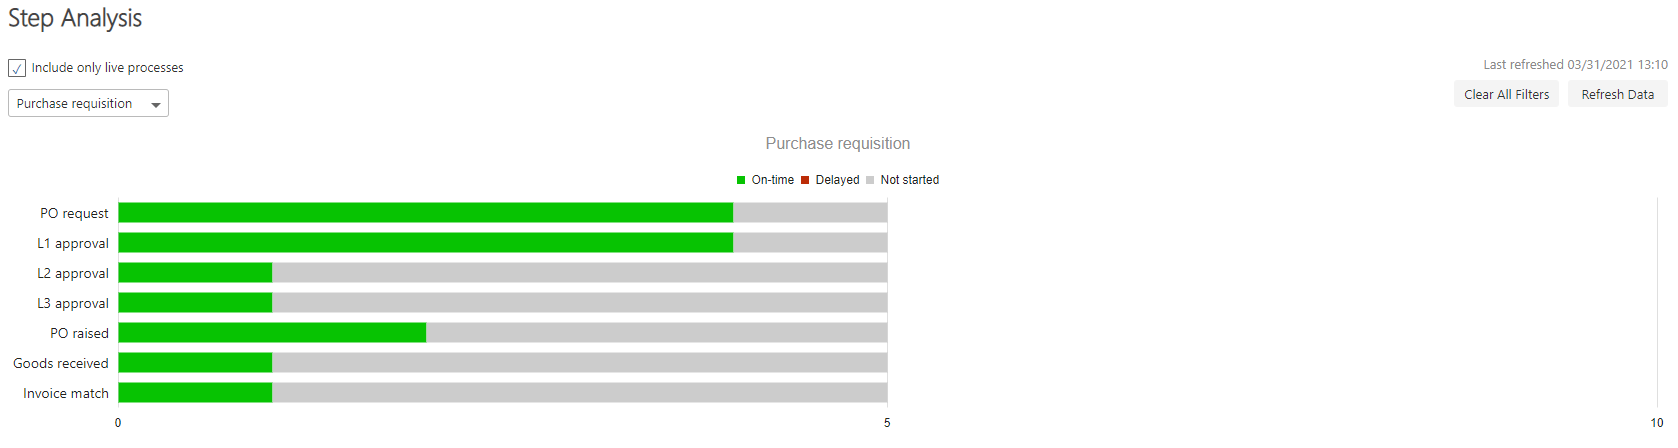
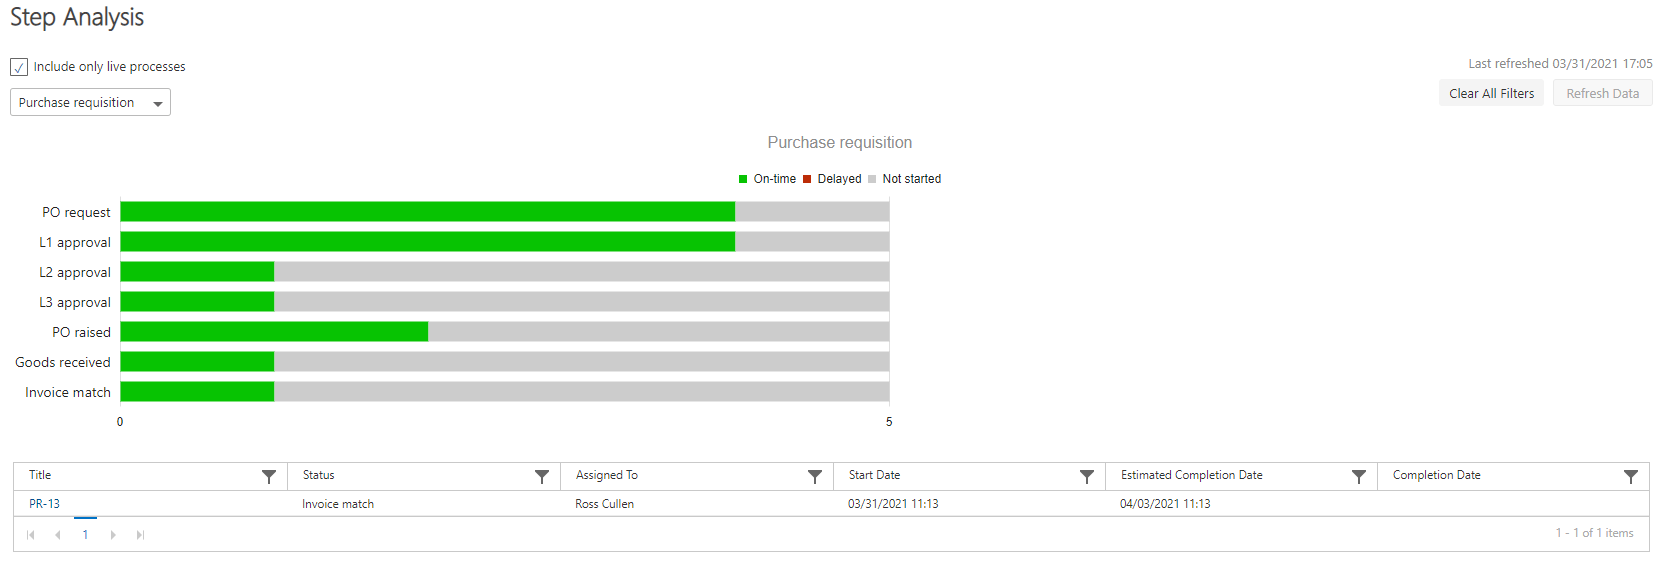
 Process performance bar chart You may decide to only display flows that have forms created for them. You can check the box for Include only live processes to filter unused flows out. Additionally, you can use the drop down menu to select a specific flow you wish to analyze. You can click on a specific flow’s bar to display a table view of the forms and more details about that flow’s performance. Table view of forms for a flow This table provides options to further filter the displayed forms, using the funnel icon and entering values to filter by. For example, you may only want to view forms on a particular step, or assigned to a particular user. Filtering forms in the table view In the top right corner, you can use the Clear All Filters button to return to the default view. You also have the option to refresh the data. This happens automatically every 12 hours, or you can manually click Refresh Data to get the latest data, up to once every 15 minutes.

Step analysis

This page displays a bar chart similar to the process performance page. However, where process performance digs down into the status of forms belonging to a flow, step analysis digs down into the performance of the steps in that process. To do this, you can either click on the bar chart row for the flow you wish to analyze, or use the drop down menu to select a flow. Selecting a flow for step analysis Once you have selected a flow, the steps within that flow are displayed in a bar chart showing their “time to complete” status. Bar chart of step time to complete status You can click on a row in the bar chart for a step to display a table of the forms on that step. Table of forms on a step