> ## Documentation Index
> Fetch the complete documentation index at: https://docs.flowforma.com/llms.txt
> Use this file to discover all available pages before exploring further.
# Trend Analysis
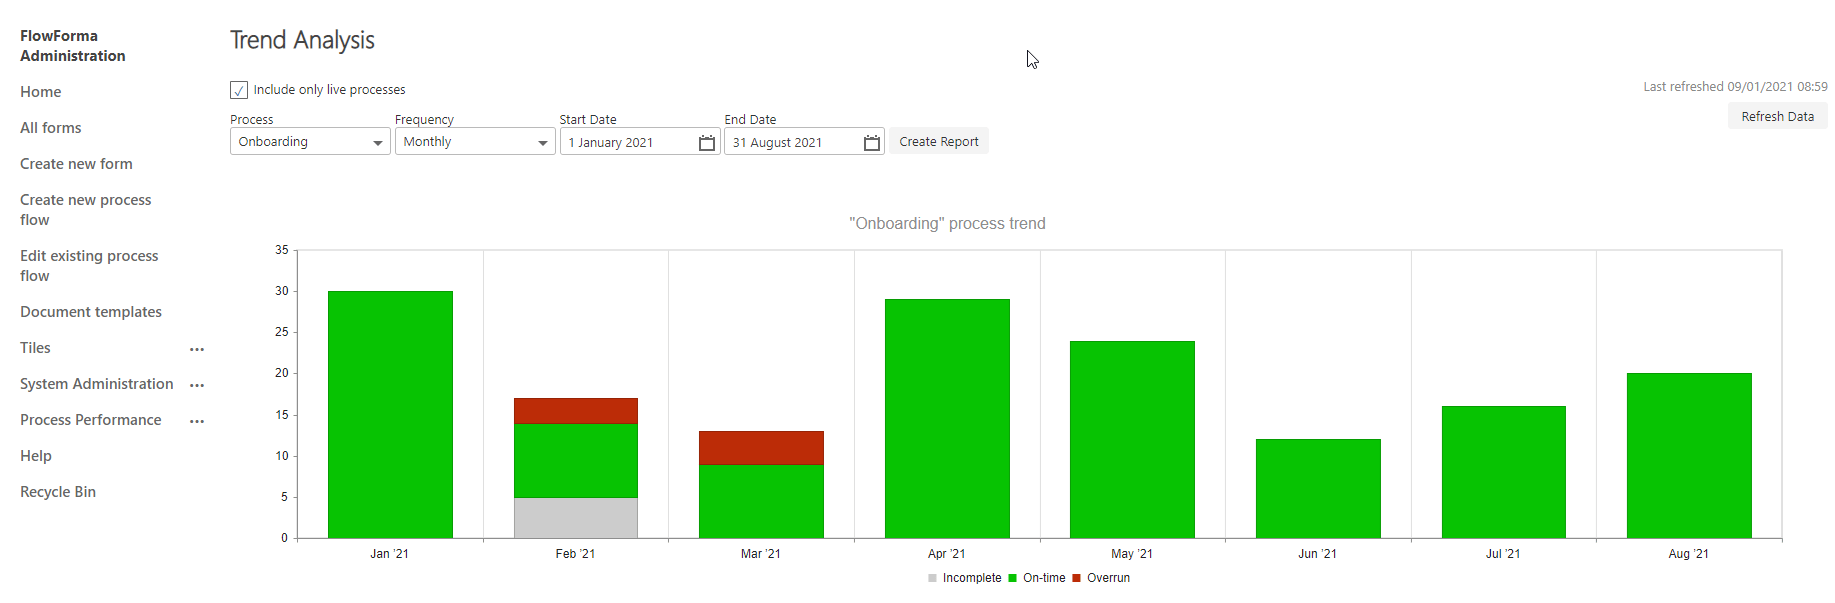
> Trend Analysis compares process performance across years, months, weeks, or days so you can spot submission spikes and measure the impact of process changes.
Trend Analysis allows you to analyze your process performance and see how it compares against other years, months, weeks, or days.
This is useful for planning effectively. For example, you may need to make more resources available for the summer months if there is a trend of a spike in form submissions during that period.
If you have made process changes to address bottlenecks, Trend Analysis lets you see whether those changes are having the desired impact.
 ## Viewing trend analysis
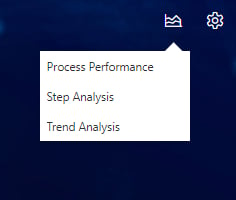
To open Trend Analysis, navigate to the homepage and click the [Process Performance](/product/process-performance/overview) icon on the top right, then select **Trend Analysis**.
## Viewing trend analysis
To open Trend Analysis, navigate to the homepage and click the [Process Performance](/product/process-performance/overview) icon on the top right, then select **Trend Analysis**.
 A new dialog loads.
 To use Trend Analysis, the options available at the top of the page allow you to:
**Include only live processes**: Include only live processes, i.e. flows that are licensed, and hide unlicensed flows from selection
**Use estimated duration before FlowForma**: the analysis compares actual completion times against an estimated duration. Check this option to base that estimate on the step-level "Time to complete before FlowForma" values (the pre-FlowForma baseline) instead of the standard FlowForma "Time to complete" estimate, so you can see how current completion times compare to the process before it was implemented in FlowForma
**Process**: Select the flow you want to run the trend analysis on
**Frequency**: Select the frequency: Daily, Weekly, Monthly, or Yearly
**Start Date**: Select a starting date for the analysis
**End Date**: Select an end date for the analysis
**Create Report**: Once all options have been selected, the Create Report button generates the bar chart with the relevant details
**Refresh Data**: Data is refreshed once per day. You can manually refresh to get the latest data using this option, but it can only be done every 15 minutes.
To use Trend Analysis, the options available at the top of the page allow you to:
**Include only live processes**: Include only live processes, i.e. flows that are licensed, and hide unlicensed flows from selection
**Use estimated duration before FlowForma**: the analysis compares actual completion times against an estimated duration. Check this option to base that estimate on the step-level "Time to complete before FlowForma" values (the pre-FlowForma baseline) instead of the standard FlowForma "Time to complete" estimate, so you can see how current completion times compare to the process before it was implemented in FlowForma
**Process**: Select the flow you want to run the trend analysis on
**Frequency**: Select the frequency: Daily, Weekly, Monthly, or Yearly
**Start Date**: Select a starting date for the analysis
**End Date**: Select an end date for the analysis
**Create Report**: Once all options have been selected, the Create Report button generates the bar chart with the relevant details
**Refresh Data**: Data is refreshed once per day. You can manually refresh to get the latest data using this option, but it can only be done every 15 minutes.