> ## Documentation Index
> Fetch the complete documentation index at: https://docs.flowforma.com/llms.txt
> Use this file to discover all available pages before exploring further.
# Reporting, OData and PowerPivots
> Connect Excel PowerPivot to the FlowForma OData feed to import form, step, and question data and build advanced pivot table reports on your flows.
If you need more detailed reporting than activity monitoring can provide, FlowForma provides customised OData feeds of form progression, step details, and answers to questions. You can use these feeds in any reporting tool that supports OData, so you can set up advanced reporting based on your flows. Watch this quick overview video for more information:
The information below outlines the setup in Excel using PowerPivot.
Microsoft PowerPivot for Excel is an add-in that you can use to perform powerful data analysis in **Excel 2010 and above**.
To bring in data from FlowForma, you must be a FlowForma administrator for the site you want to access. You can have one feed per site, and you can restrict data access on the feed as follows:
* There is a single update feed per FlowForma site
* Only members of the FlowForma Admins group can access the feed for that site
* If you can access the feed, then you can get all data from that site
* You can apply filters in PowerPivot to restrict the data set that inputs into the Pivot Table
1. Open **Microsoft Excel 2010 or above**
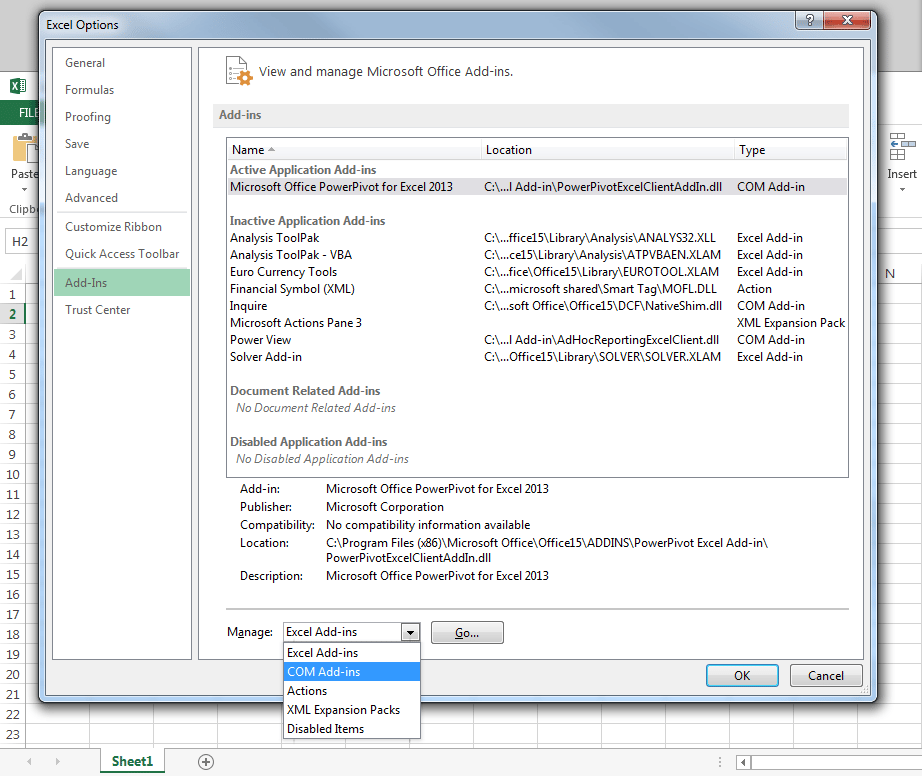
2. Go to **file** and select **options**
3. Select the **add-ins** tab; then select **COM add-ins** from the **manage** drop-down menu and click **go**
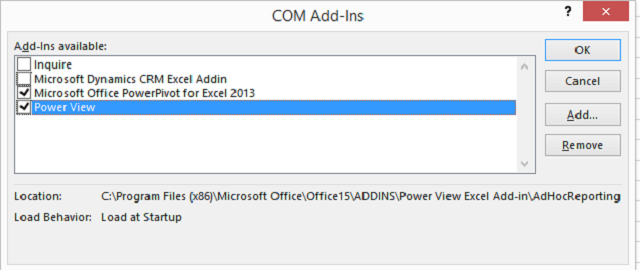
4. Select **Microsoft Office PowerPivot for Excel 2013** and **Power View**, then click **OK**.
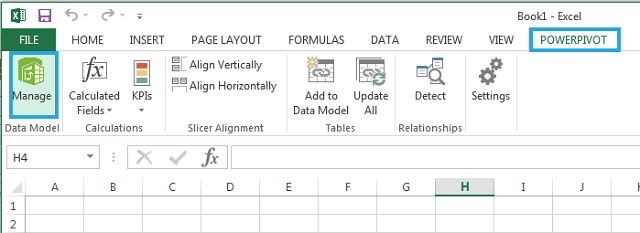
5. Go to **POWERPIVOT** and select **manage** from the ribbon. A new window opens.
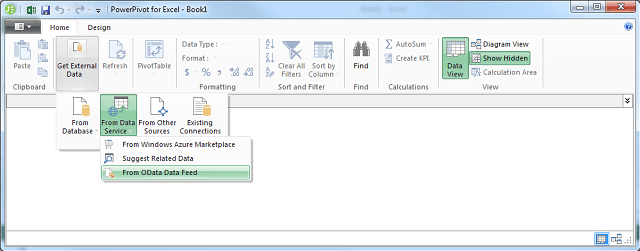
6. Go to **get external data**, select **from data service** and then select **from OData data feed**
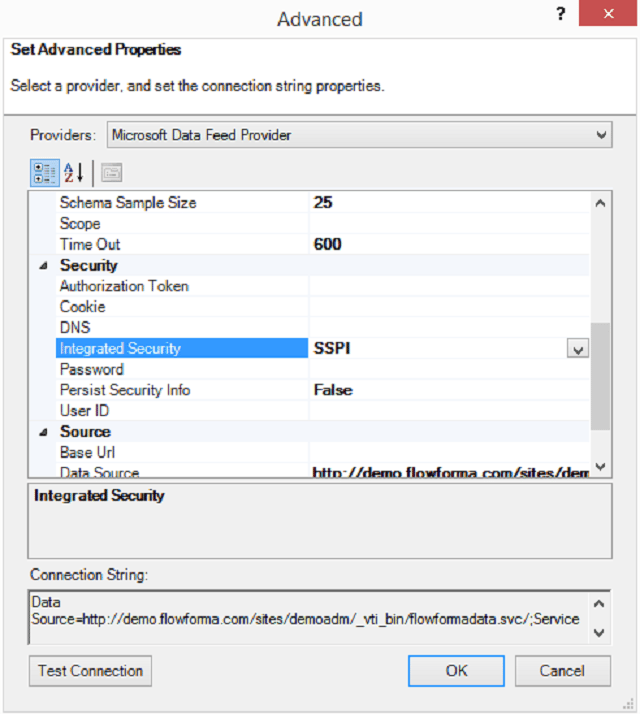
Click **advanced** to open the advanced features.
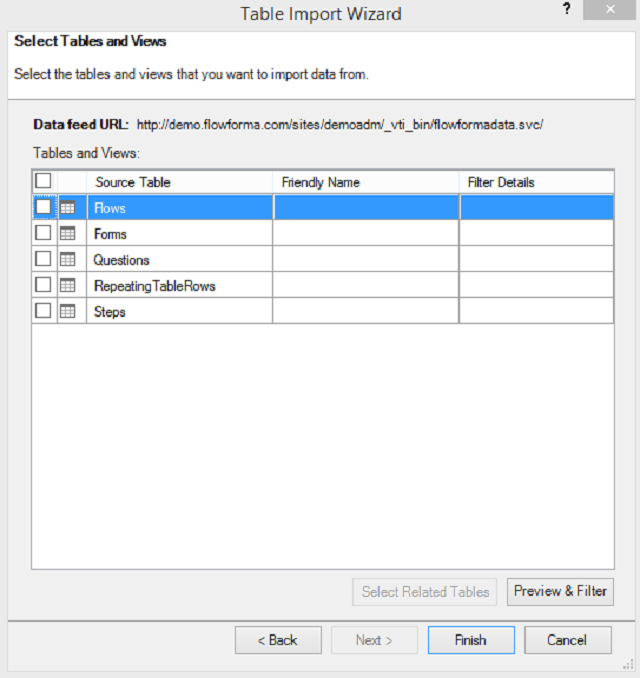
7. Change SSPI to Basic, enter your **user ID** and **password**, then click **test connection**. If the test connection is successful, click **OK**, followed by **next**. The **table import wizard** opens. Select all items in **source table** and click **finish**.
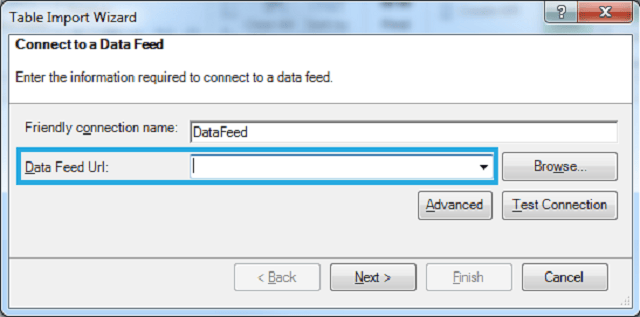
8. In the **table import wizard**, enter the URL for the OData feed. The URL must be in the format: `https://odata-app.flowforma.com/{TOKEN}/_vti_bin/FlowFormaOData.svc/` (O365), or `http://siteurl/_vti_bin/flowformadata.svc/` (on-premise)
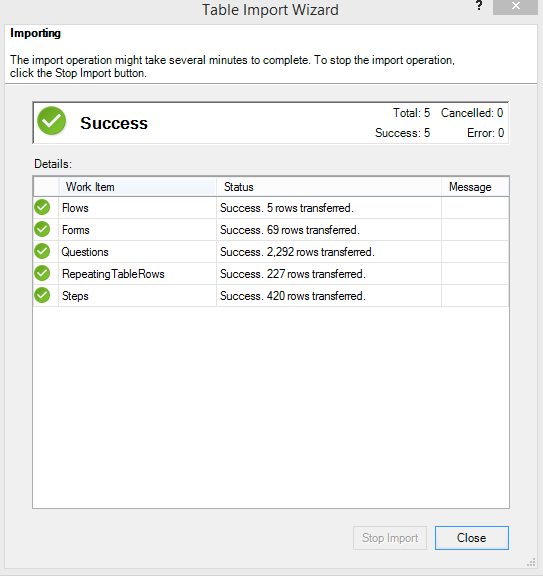
9. Once everything is imported, the **table import wizard** shows the status for each source table. Click **close**
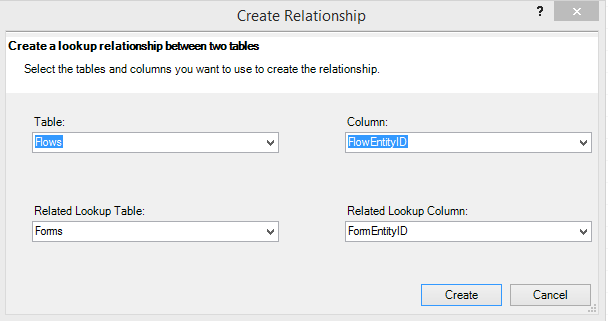
Before creating a pivot table, you need to create relationships between tables. Go to **design** and select **create relationship** from the ribbon.
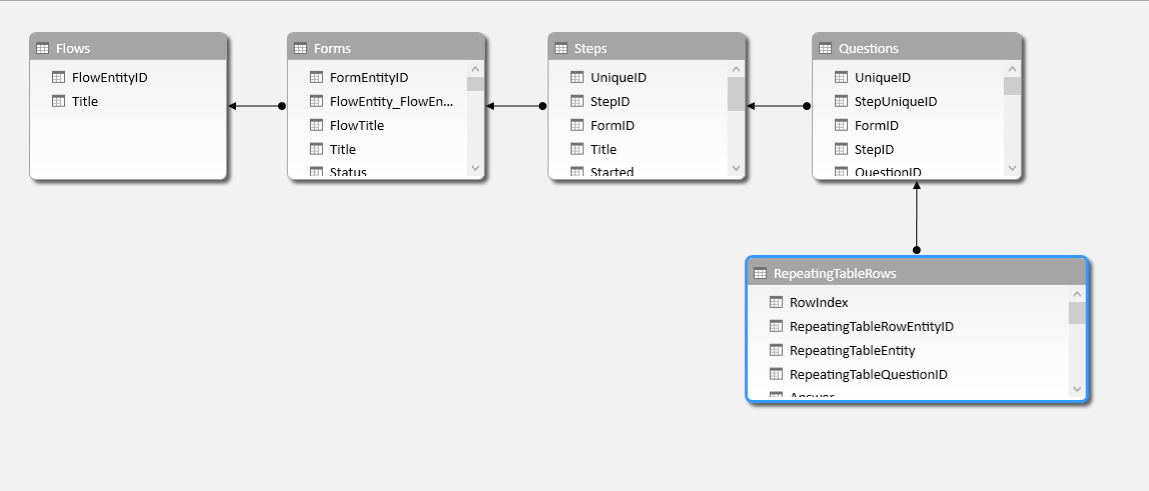
You need to create the following relationships (in the image below, they are displayed right to left):
* FROM **Questions - StepUniqueID** TO **Steps - UniqueID**
* FROM **Steps - FormID** TO **Forms - FormID**
* FROM **Forms - FlowID** TO **Flows - FlowID**
* If you have repeating tables, you also need FROM **Repeating Table Rows - RepeatingTableEntity** TO **Questions - UniqueID**
If you prefer, you can also create relationships by using the **diagram view**, which you can select from the lower right corner of PowerPivot. To create a relationship, drag from one entity ID to another.
To create the pivot table go to **home** and click **PivotTable**
To learn how to group data, you may find this short video of use:
 4. Select **Microsoft Office PowerPivot for Excel 2013** and **Power View**, then click **OK**.
 5. Go to **POWERPIVOT** and select **manage** from the ribbon. A new window opens.
 6. Go to **get external data**, select **from data service** and then select **from OData data feed**
 Click **advanced** to open the advanced features.
 7. Change SSPI to Basic, enter your **user ID** and **password**, then click **test connection**. If the test connection is successful, click **OK**, followed by **next**. The **table import wizard** opens. Select all items in **source table** and click **finish**.
 8. In the **table import wizard**, enter the URL for the OData feed. The URL must be in the format: `https://odata-app.flowforma.com/{TOKEN}/_vti_bin/FlowFormaOData.svc/` (O365), or `http://siteurl/_vti_bin/flowformadata.svc/` (on-premise)
 9. Once everything is imported, the **table import wizard** shows the status for each source table. Click **close**
 Before creating a pivot table, you need to create relationships between tables. Go to **design** and select **create relationship** from the ribbon.
 You need to create the following relationships (in the image below, they are displayed right to left):
* FROM **Questions - StepUniqueID** TO **Steps - UniqueID**
* FROM **Steps - FormID** TO **Forms - FormID**
* FROM **Forms - FlowID** TO **Flows - FlowID**
* If you have repeating tables, you also need FROM **Repeating Table Rows - RepeatingTableEntity** TO **Questions - UniqueID**
If you prefer, you can also create relationships by using the **diagram view**, which you can select from the lower right corner of PowerPivot. To create a relationship, drag from one entity ID to another.
You need to create the following relationships (in the image below, they are displayed right to left):
* FROM **Questions - StepUniqueID** TO **Steps - UniqueID**
* FROM **Steps - FormID** TO **Forms - FormID**
* FROM **Forms - FlowID** TO **Flows - FlowID**
* If you have repeating tables, you also need FROM **Repeating Table Rows - RepeatingTableEntity** TO **Questions - UniqueID**
If you prefer, you can also create relationships by using the **diagram view**, which you can select from the lower right corner of PowerPivot. To create a relationship, drag from one entity ID to another.
 To create the pivot table go to **home** and click **PivotTable**
To learn how to group data, you may find this short video of use:
To create the pivot table go to **home** and click **PivotTable**
To learn how to group data, you may find this short video of use: