> ## Documentation Index
> Fetch the complete documentation index at: https://docs.flowforma.com/llms.txt
> Use this file to discover all available pages before exploring further.
# Reporting and Power BI
> Import the FlowForma Power BI content pack, point it at your OData feed, and analyse open, overdue, and completed process dashboards in real time.
## Introduction
Power BI is a suite of business analytics tools from Microsoft designed to analyse data and share insights. Power BI dashboards provide a 360-degree view for business users with their most important metrics in one place, updated in real time, and available on all of their devices.
With Power BI, you can build reports quickly from various data sources, both in the cloud and on-premise.
### FlowForma Power BI content pack
You can import the Power BI content pack as follows:
* You can import the FlowForma Power BI content pack from the FlowForma website.
* Click **Download Content Pack** to download **FlowForma BPM - Power BI Content Pack**, then extract the contents to a location of your choice.
* Download Power BI Desktop from [https://powerbi.microsoft.com/en-us/downloads/](https://powerbi.microsoft.com/en-us/downloads/)
* After installing Power BI Desktop, right-click and open the **.pbit** file from the downloaded location. This opens the default source and default compiled reports pointing to FlowForma default data, as shown in the screenshot below.
**Note:** The reports prompt you to enter credentials to access the default site when refreshing the source. This is because the report points to a default trial/demo site, which is an on-premise trial site of FlowForma.
You can ignore any errors and change the data source later, following the steps outlined below.
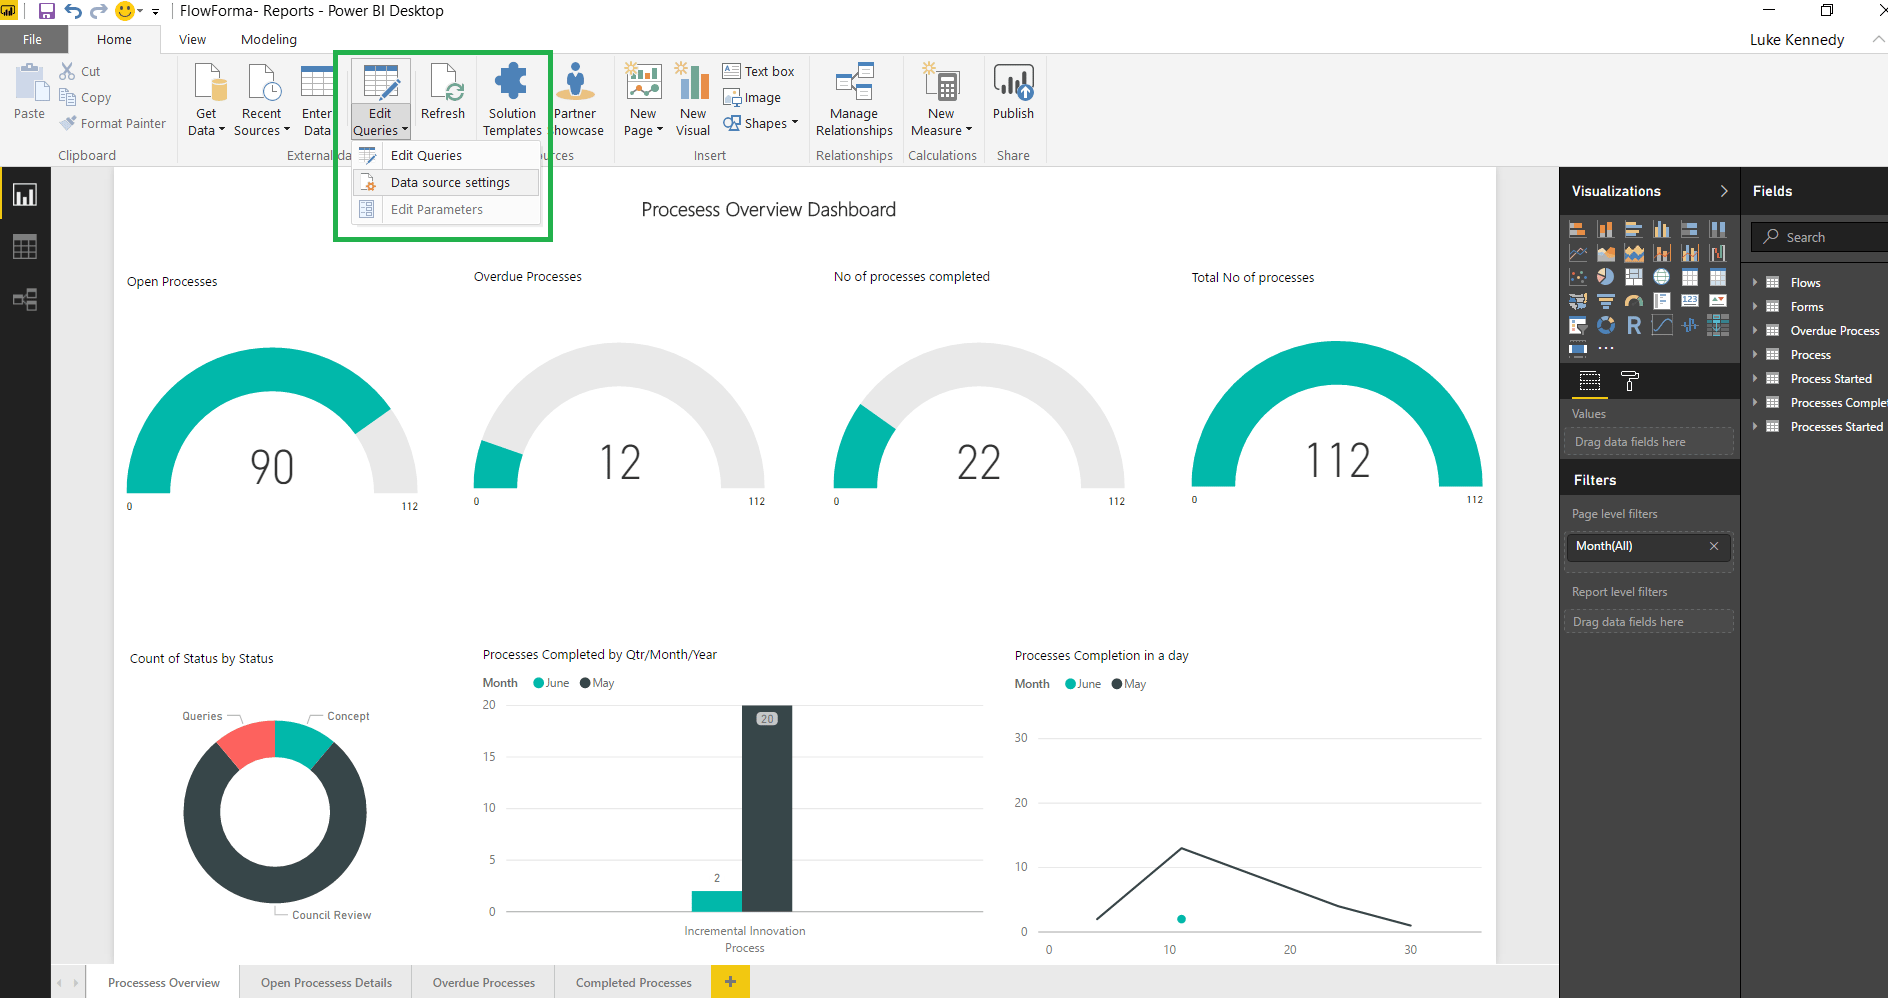
 * Next, change the data source to the required OData source link, obtained from the [FlowForma settings](/product/flowforma-settings/overview) (OData feed) of the site you want to report on. Click **Edit Queries > Data Source Settings**.
 * As shown below, clear any existing connections from **global permissions**, then select **data sources in current file** to change the **data source**.
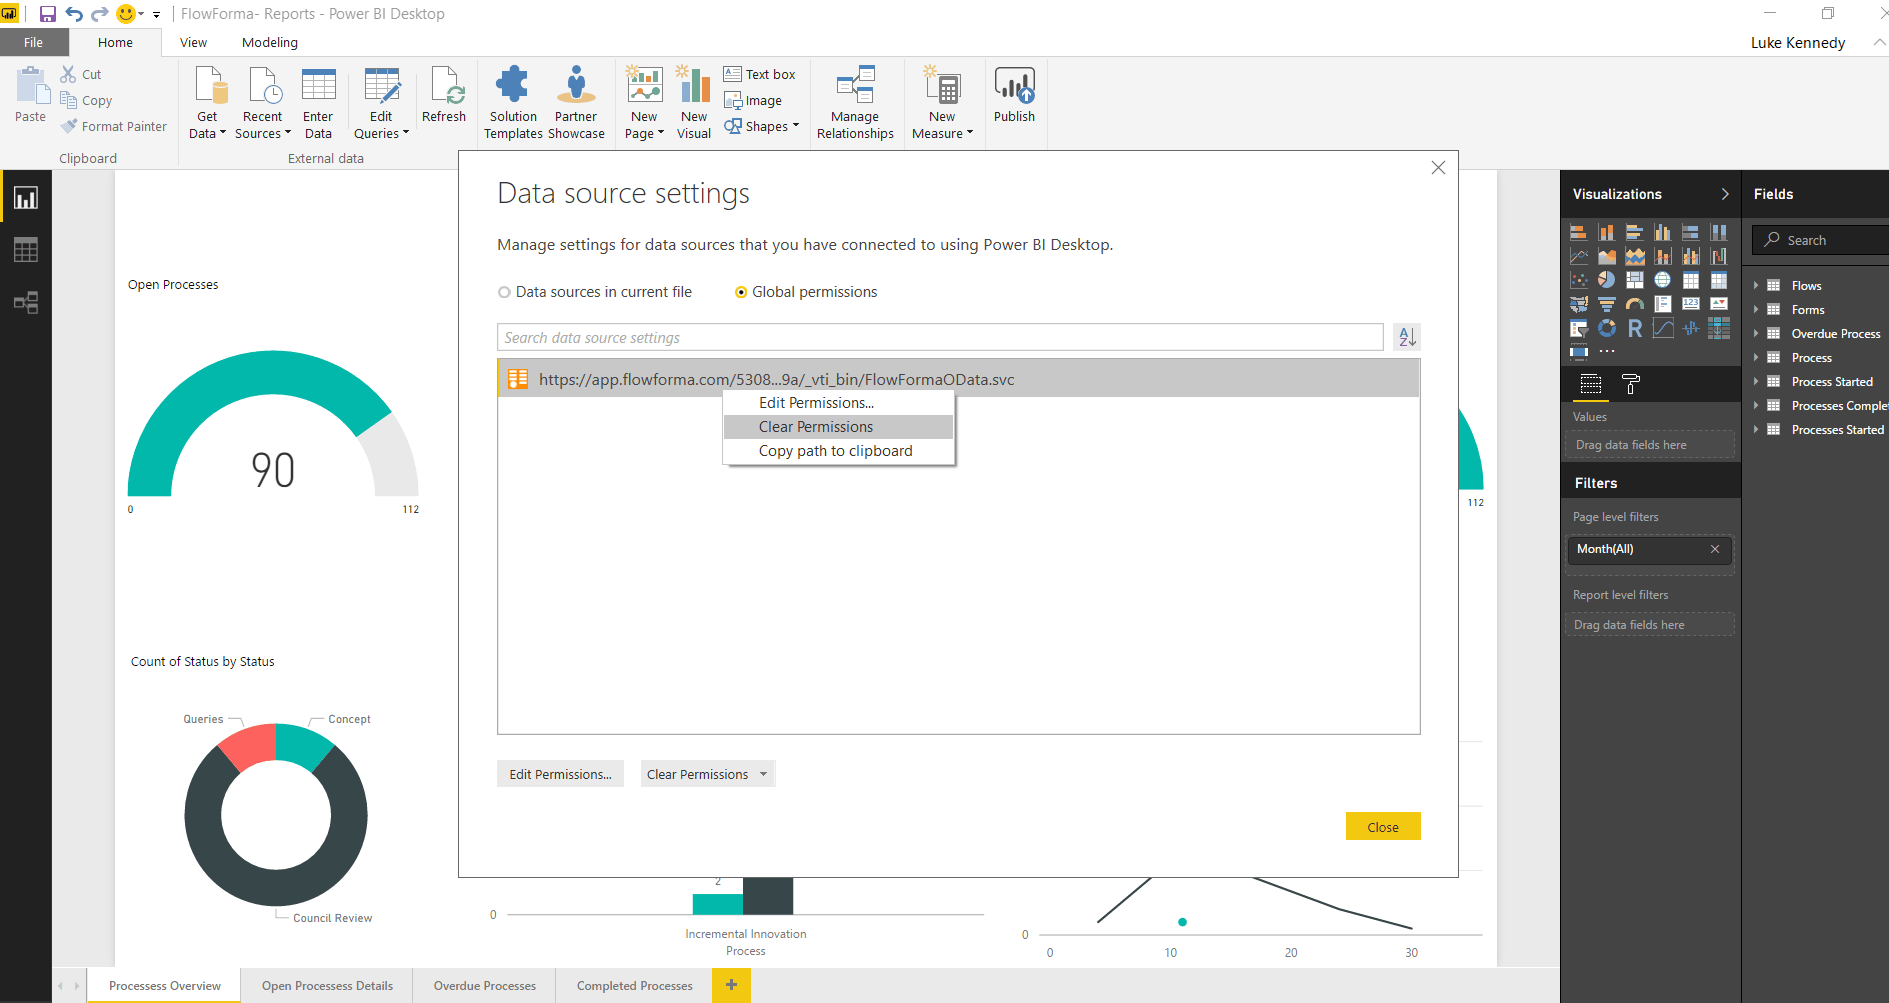 * Select **data sources in the current file** to change the data source to the required OData link obtained from the FlowForma site, as shown below.
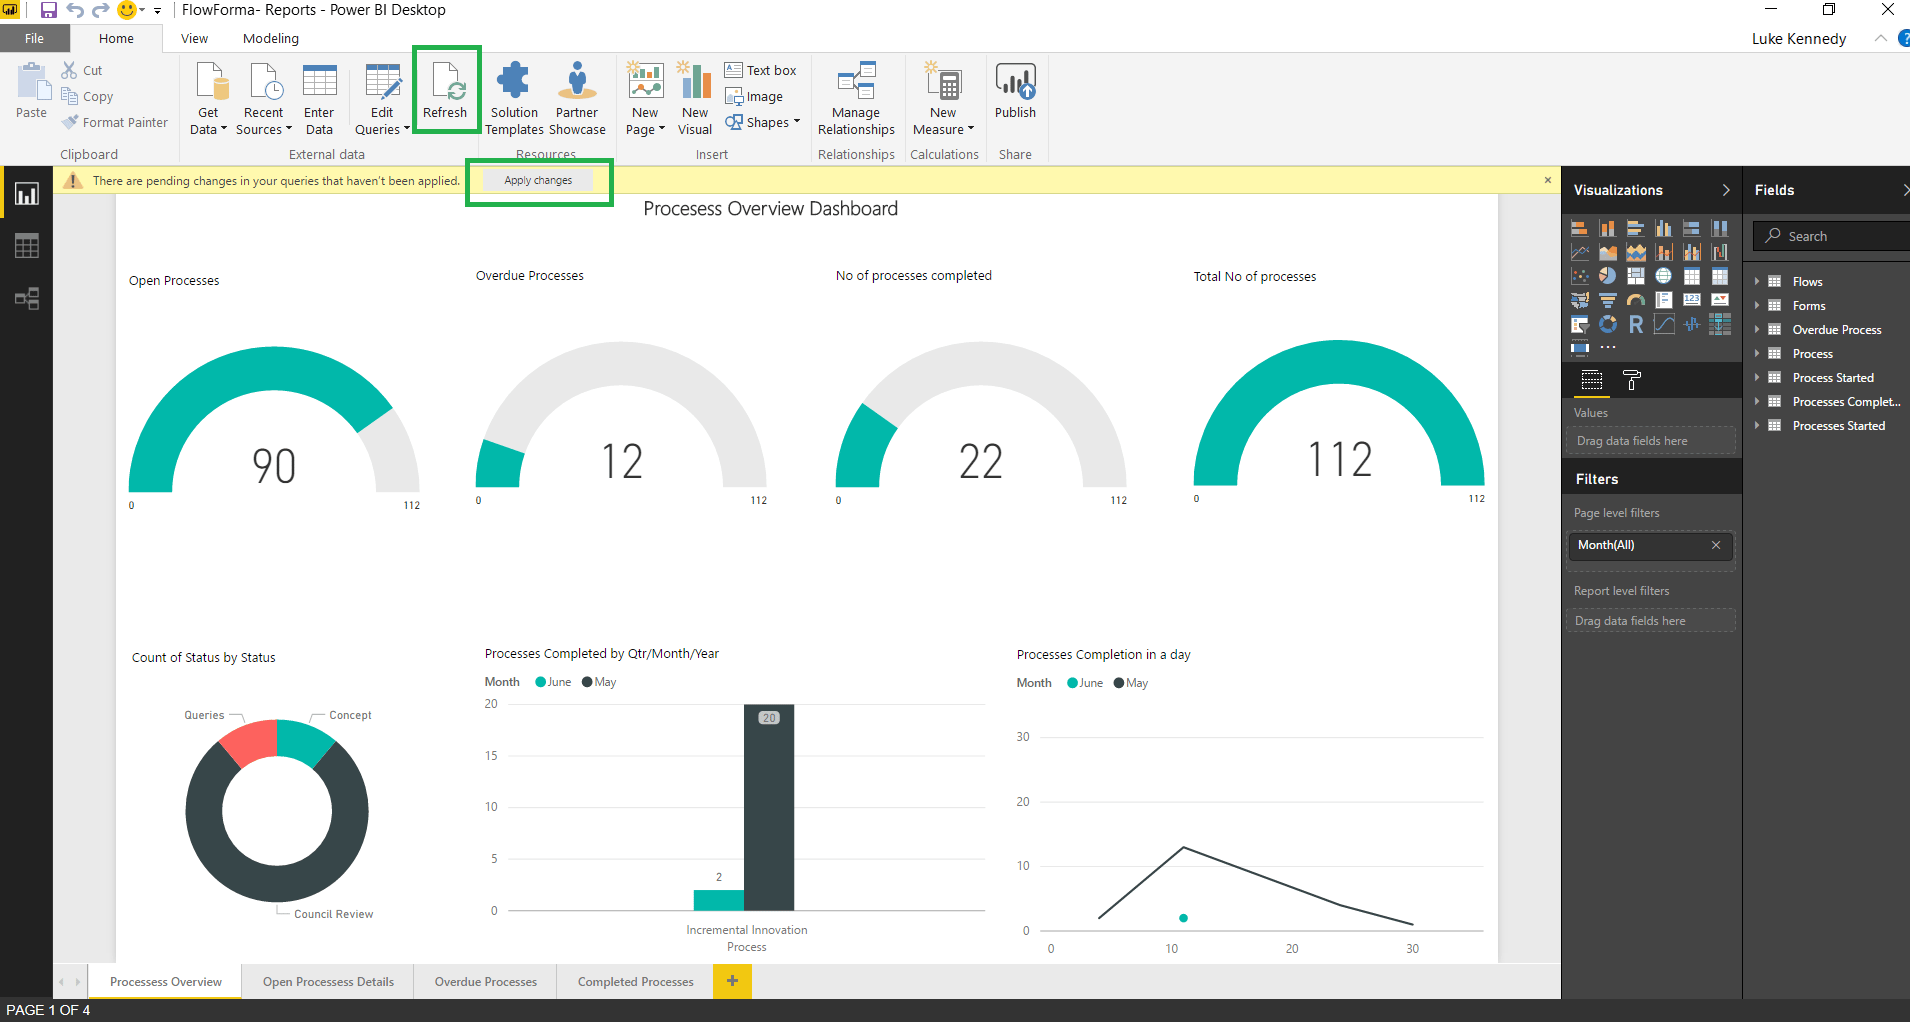
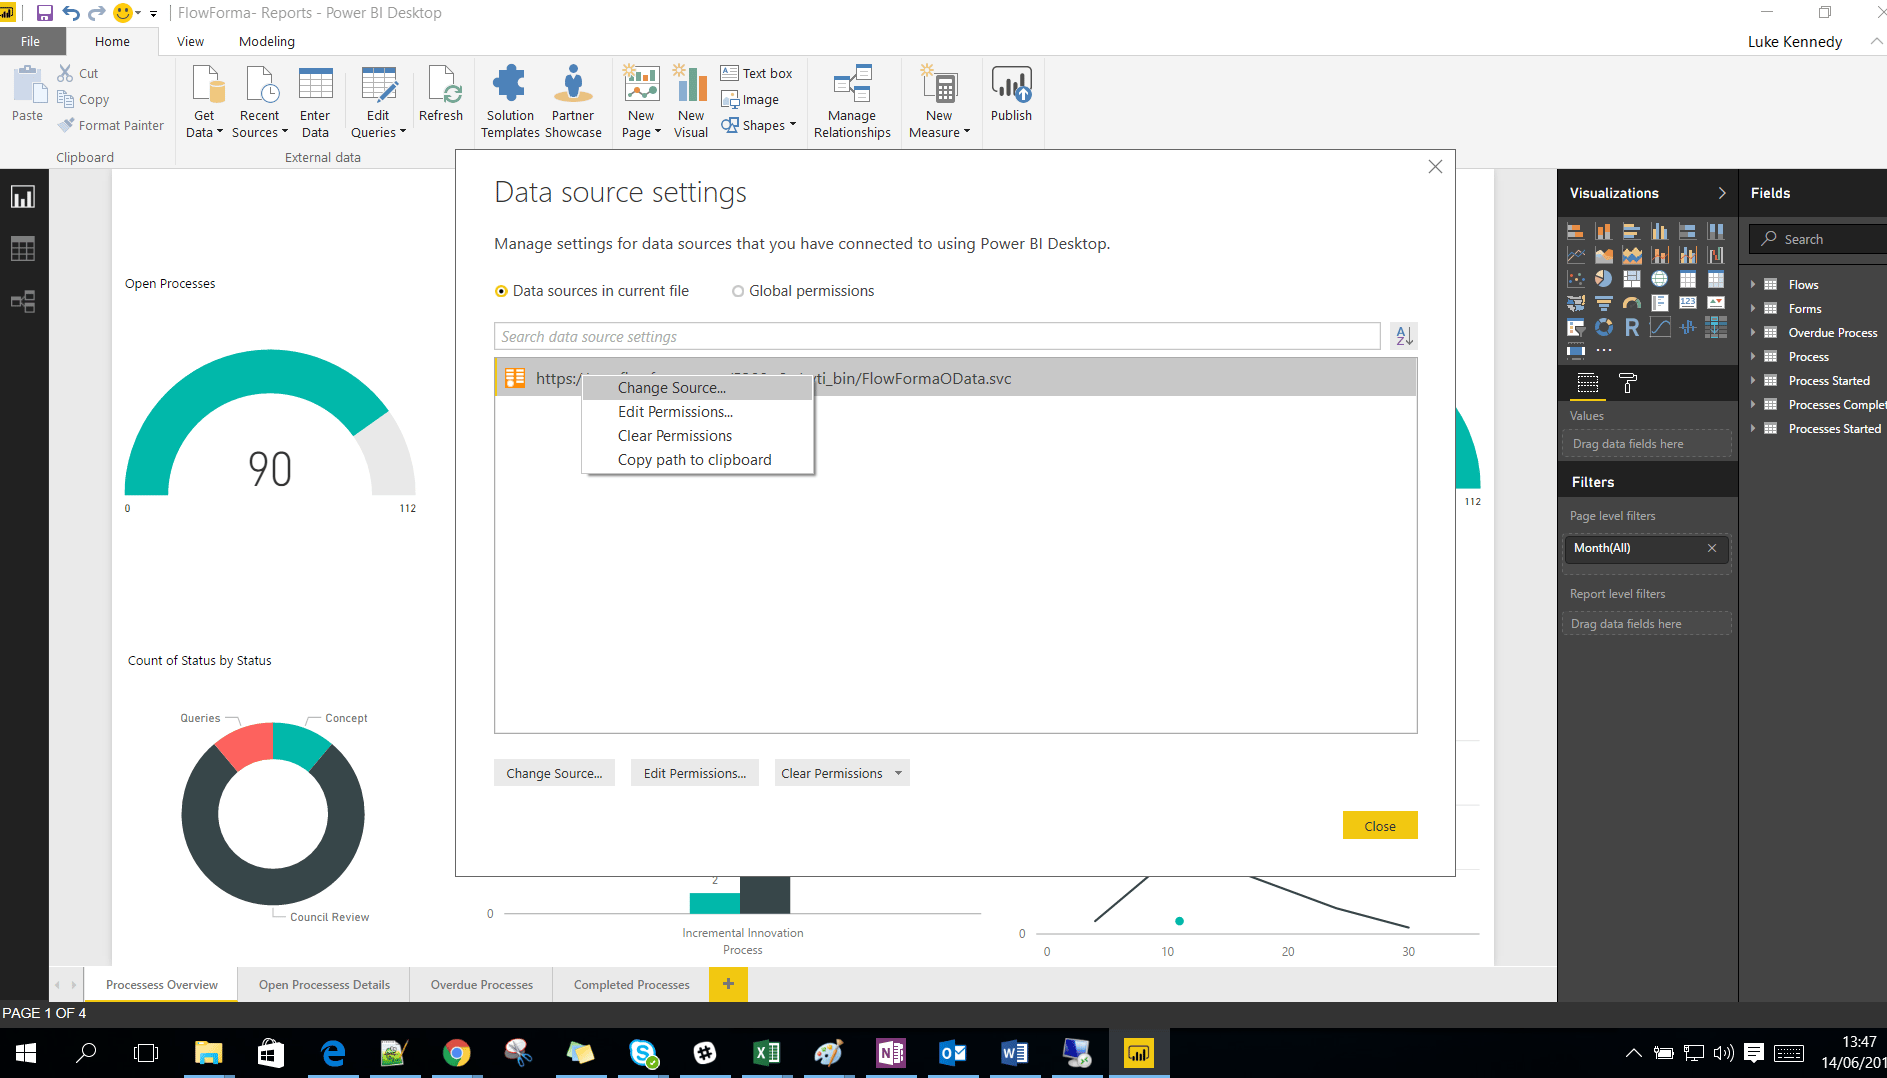 * After changing the data source, click **Edit Permissions** and set the permissions based on the OData source, which is anonymous by default. Apply the change if prompted, then refresh to pull the data. Wait a few minutes and **refresh** at least twice on all pages to ensure the data cache is cleared and new data is fetched.
 ## Troubleshooting
If you have issues changing the data source, or the latest data isn't reflected, follow the steps below.
For issues when changing **data source**:
* If an error occurs while connecting to OData sources, ensure the connecting user is added to the FlowForma admin permission group, then retry.
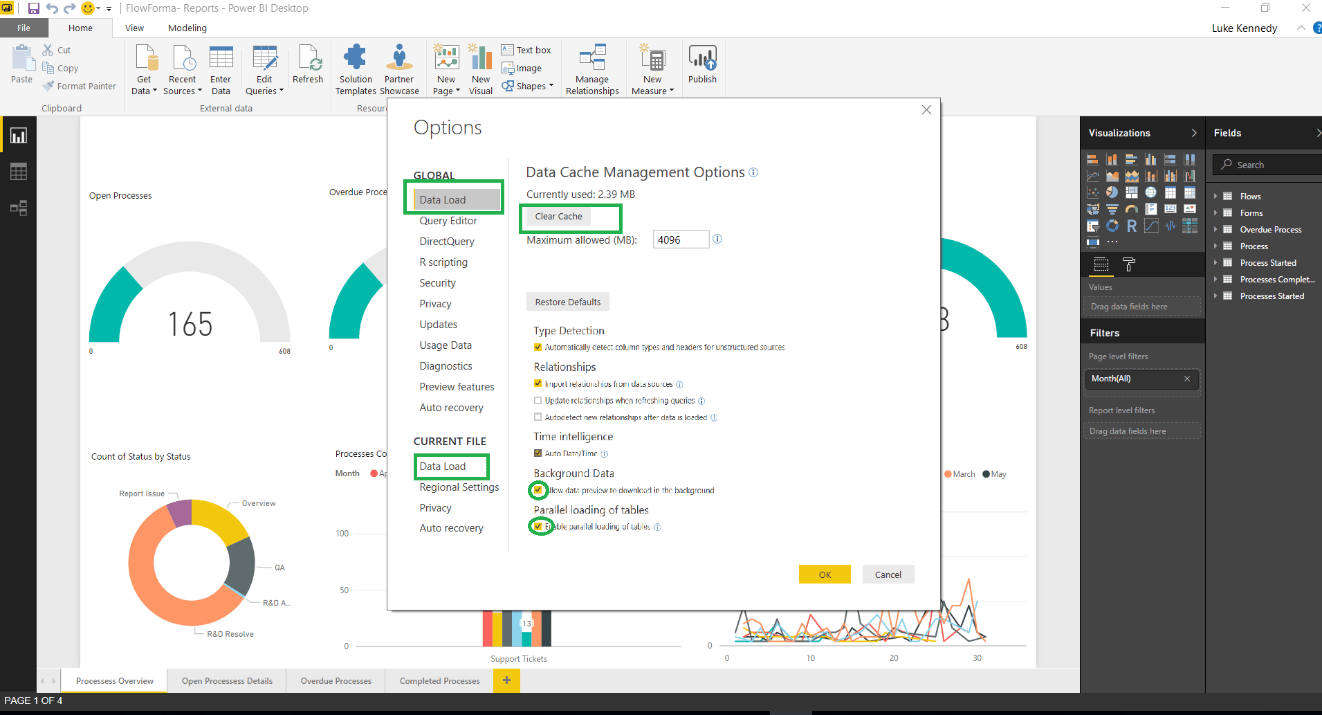
* Open Power BI Desktop, go to **File > Options and settings > Options**. On the screen shown below, clear the **data load cache**, then go to **Data Load** in the same left-hand pane and clear **"Allow data preview to download data in the background"** and **"Enable Parallel Loading of Tables"**.
## Troubleshooting
If you have issues changing the data source, or the latest data isn't reflected, follow the steps below.
For issues when changing **data source**:
* If an error occurs while connecting to OData sources, ensure the connecting user is added to the FlowForma admin permission group, then retry.
* Open Power BI Desktop, go to **File > Options and settings > Options**. On the screen shown below, clear the **data load cache**, then go to **Data Load** in the same left-hand pane and clear **"Allow data preview to download data in the background"** and **"Enable Parallel Loading of Tables"**.
 * Close and reopen Power BI, then refresh the data sources again.
### Reports
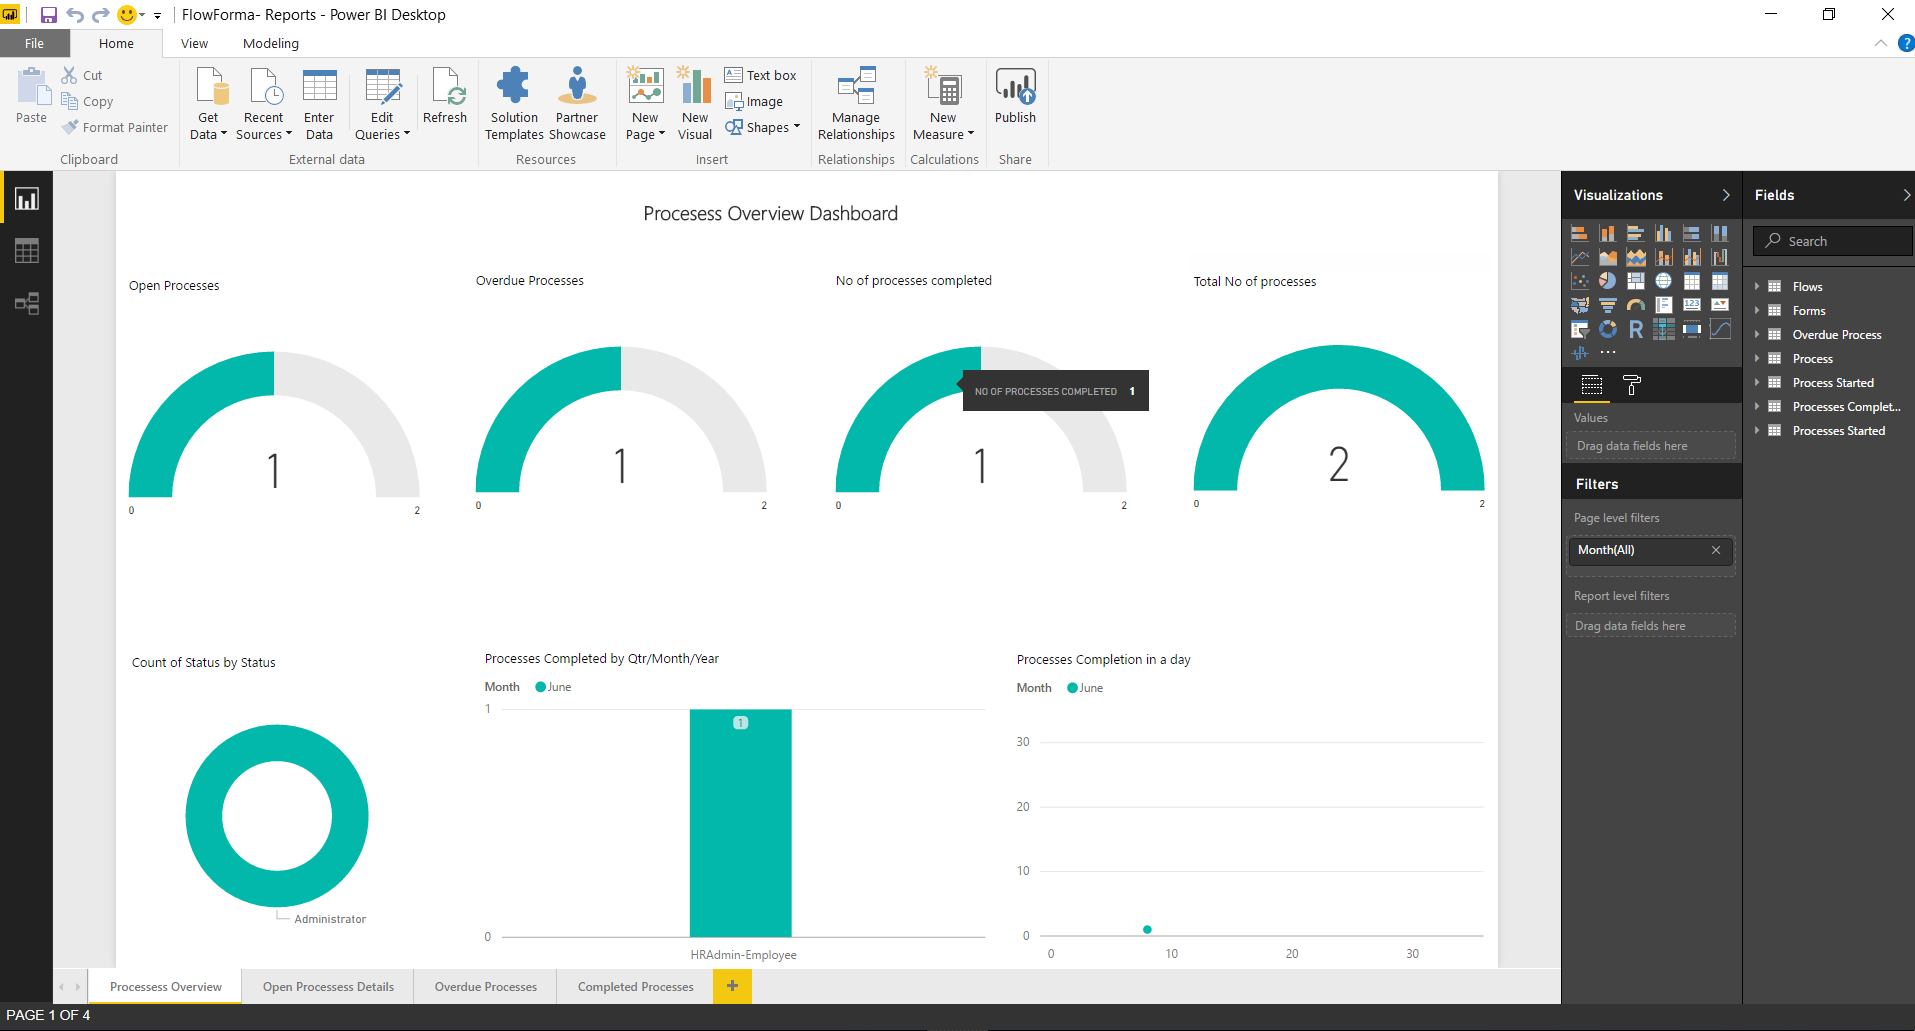
#### Process overview
The below report gives you a snapshot of the current processes that are:
* Open
* Overdue
* Number of processes completed
* Total number of processes
* Count of each status
* Processes completed in Qtr, Month, Year
* Processes completed in a day
* Of 637 processes, 166 are open and overdue.
* Of 637 processes, 471 have been completed overall.
* Close and reopen Power BI, then refresh the data sources again.
### Reports
#### Process overview
The below report gives you a snapshot of the current processes that are:
* Open
* Overdue
* Number of processes completed
* Total number of processes
* Count of each status
* Processes completed in Qtr, Month, Year
* Processes completed in a day
* Of 637 processes, 166 are open and overdue.
* Of 637 processes, 471 have been completed overall.
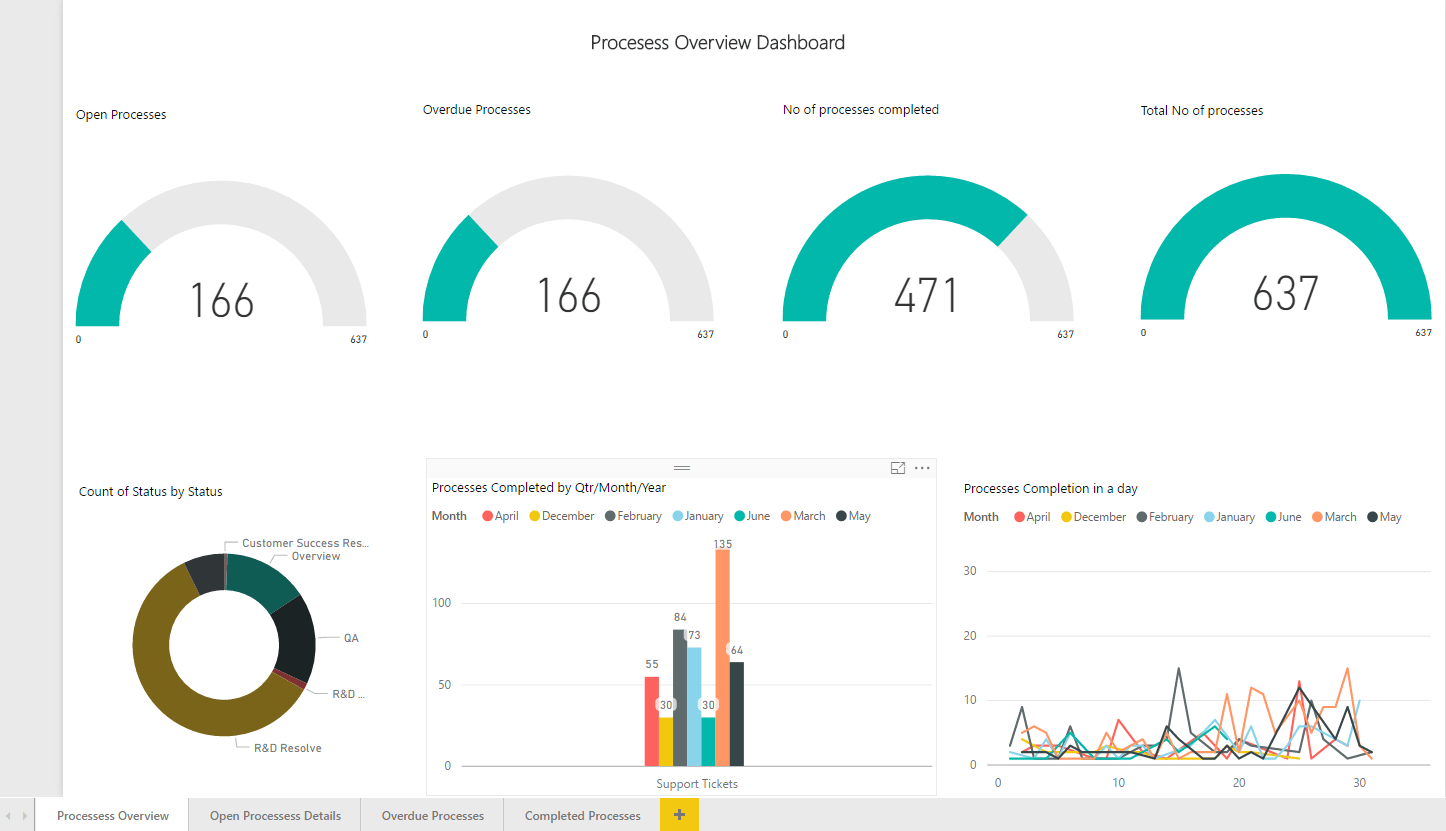 The sum of open and completed processes should equal the total number of processes, which as shown above is correct: **166 + 471 = 637**.
The individual report can be filtered by
* **Day**
* **Qtr**
* **Month**
* **Year**
* **Statuses**
Additional page level filters can be applied and published to the end users. Filters that are available and can be published with default content packs are:
* **By Flow**
* **By Month**
* **By No of Processes Completed**
**Count of status by status**: this graph represents the number of forms open on each step
**Processes completed by Qtr / Month / Year**: this report shows the number of forms completed per flow so far
**Processes completion in a day**: this report shows how many forms were completed in the same day
#### Open processes details
The second category of report the content pack can produce is a more structured breakdown of the details of each process, measured against particular timescales: **Years, Qtrs, Months, Weeks, and Days.**
The screenshot below shows a snapshot of the open processes and reports details such as:
* Processes spanning a particular timescale
* An overview of each process based on its open process details
The sum of open and completed processes should equal the total number of processes, which as shown above is correct: **166 + 471 = 637**.
The individual report can be filtered by
* **Day**
* **Qtr**
* **Month**
* **Year**
* **Statuses**
Additional page level filters can be applied and published to the end users. Filters that are available and can be published with default content packs are:
* **By Flow**
* **By Month**
* **By No of Processes Completed**
**Count of status by status**: this graph represents the number of forms open on each step
**Processes completed by Qtr / Month / Year**: this report shows the number of forms completed per flow so far
**Processes completion in a day**: this report shows how many forms were completed in the same day
#### Open processes details
The second category of report the content pack can produce is a more structured breakdown of the details of each process, measured against particular timescales: **Years, Qtrs, Months, Weeks, and Days.**
The screenshot below shows a snapshot of the open processes and reports details such as:
* Processes spanning a particular timescale
* An overview of each process based on its open process details
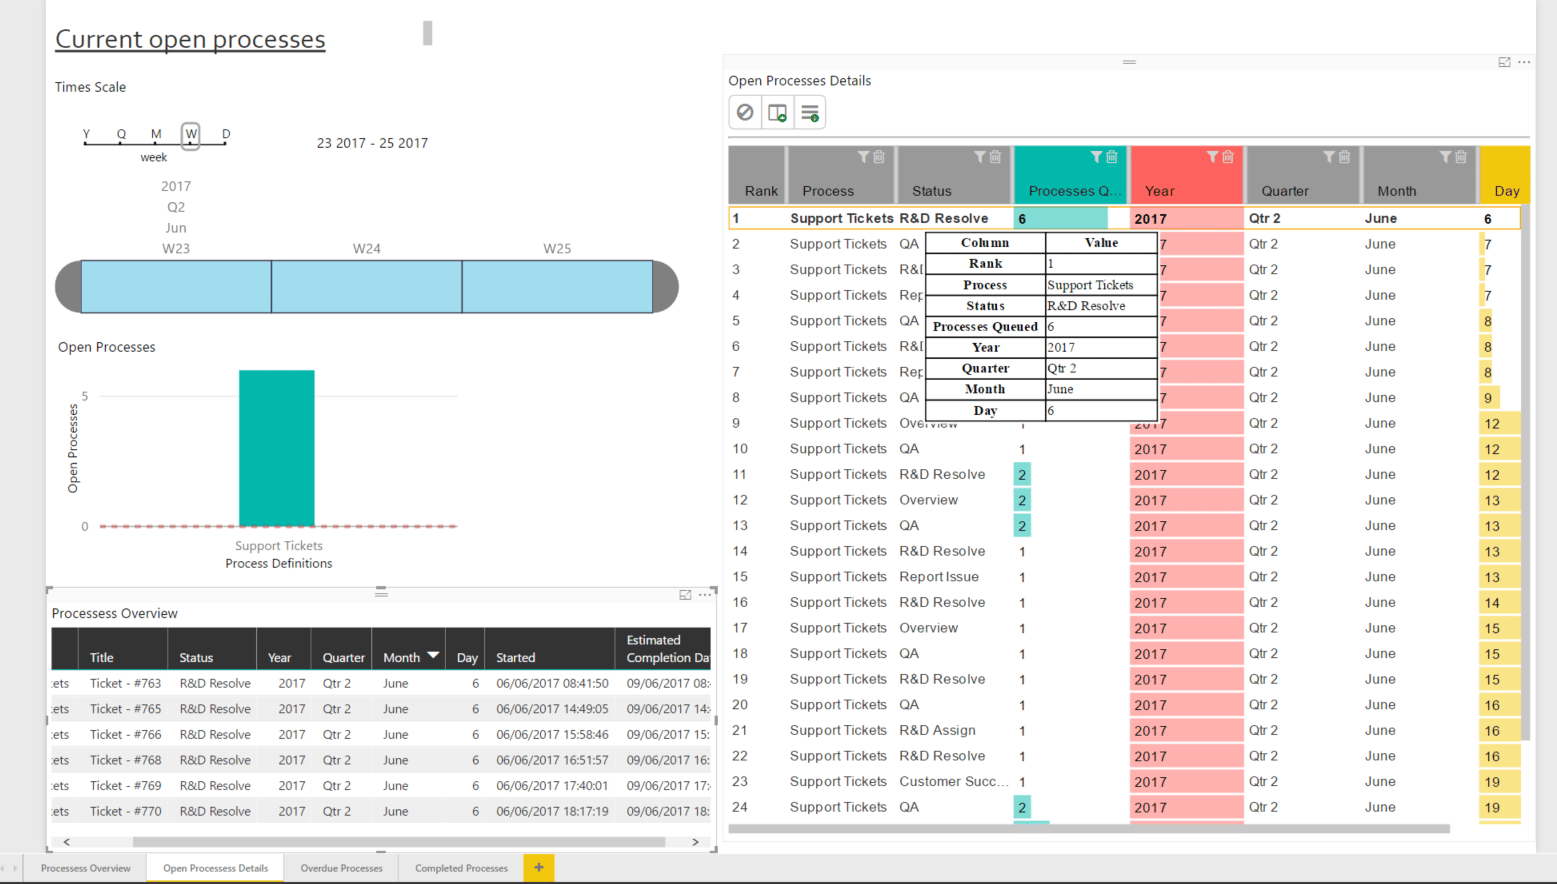 **Time scale**: You can limit the data displayed by selecting a specified period. For example, in this report above, a period selected between the start of June 2017 with the available weeks in June (week 23 to week 25) will filter processes that are open irrespective of status
**Open processes**: this graph represents the number of open processes by flow name
**Processes overview**: list of open forms. Each process detail links to its processes overview. For example, selecting the first process from open processes details highlights all the processes associated with it in the processes overview report
**Open processes details**: list of open forms. There are 6 processes queued in the Processes Details report, which filters all 6 processes with its overview in the overview report
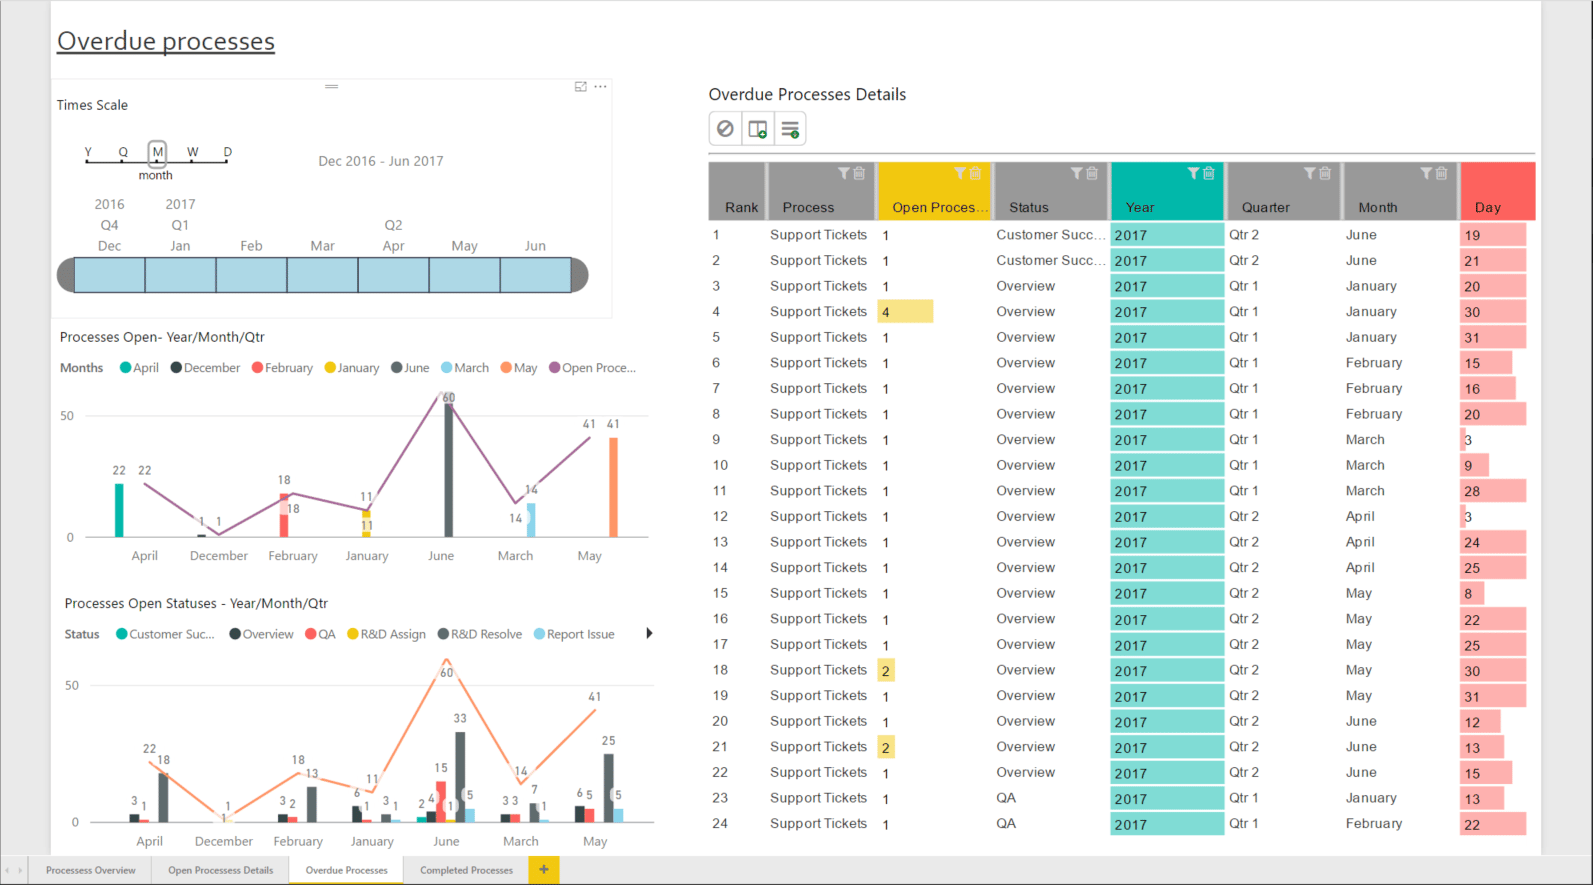
#### Overdue processes
The next category of report the content pack can produce is overdue processes. This report shows open processes that are overdue for completion.
The screenshot below gives you an overview of overdue processes:
* Processes open by Year, Month, Qtr.
* Processes open by status by Year, Month, Qtr.
The processes are measured against a time scale which can be filtered by year, quarter, month, day, week etc.
For example, selecting a time scale yields process details, and selecting a process detail highlights all overdue processes open by year, month, and day, as well as by process status.
All the reports in the dashboard update dynamically based on your selection.
**Time scale**: You can limit the data displayed by selecting a specified period. For example, in this report above, a period selected between the start of June 2017 with the available weeks in June (week 23 to week 25) will filter processes that are open irrespective of status
**Open processes**: this graph represents the number of open processes by flow name
**Processes overview**: list of open forms. Each process detail links to its processes overview. For example, selecting the first process from open processes details highlights all the processes associated with it in the processes overview report
**Open processes details**: list of open forms. There are 6 processes queued in the Processes Details report, which filters all 6 processes with its overview in the overview report
#### Overdue processes
The next category of report the content pack can produce is overdue processes. This report shows open processes that are overdue for completion.
The screenshot below gives you an overview of overdue processes:
* Processes open by Year, Month, Qtr.
* Processes open by status by Year, Month, Qtr.
The processes are measured against a time scale which can be filtered by year, quarter, month, day, week etc.
For example, selecting a time scale yields process details, and selecting a process detail highlights all overdue processes open by year, month, and day, as well as by process status.
All the reports in the dashboard update dynamically based on your selection.
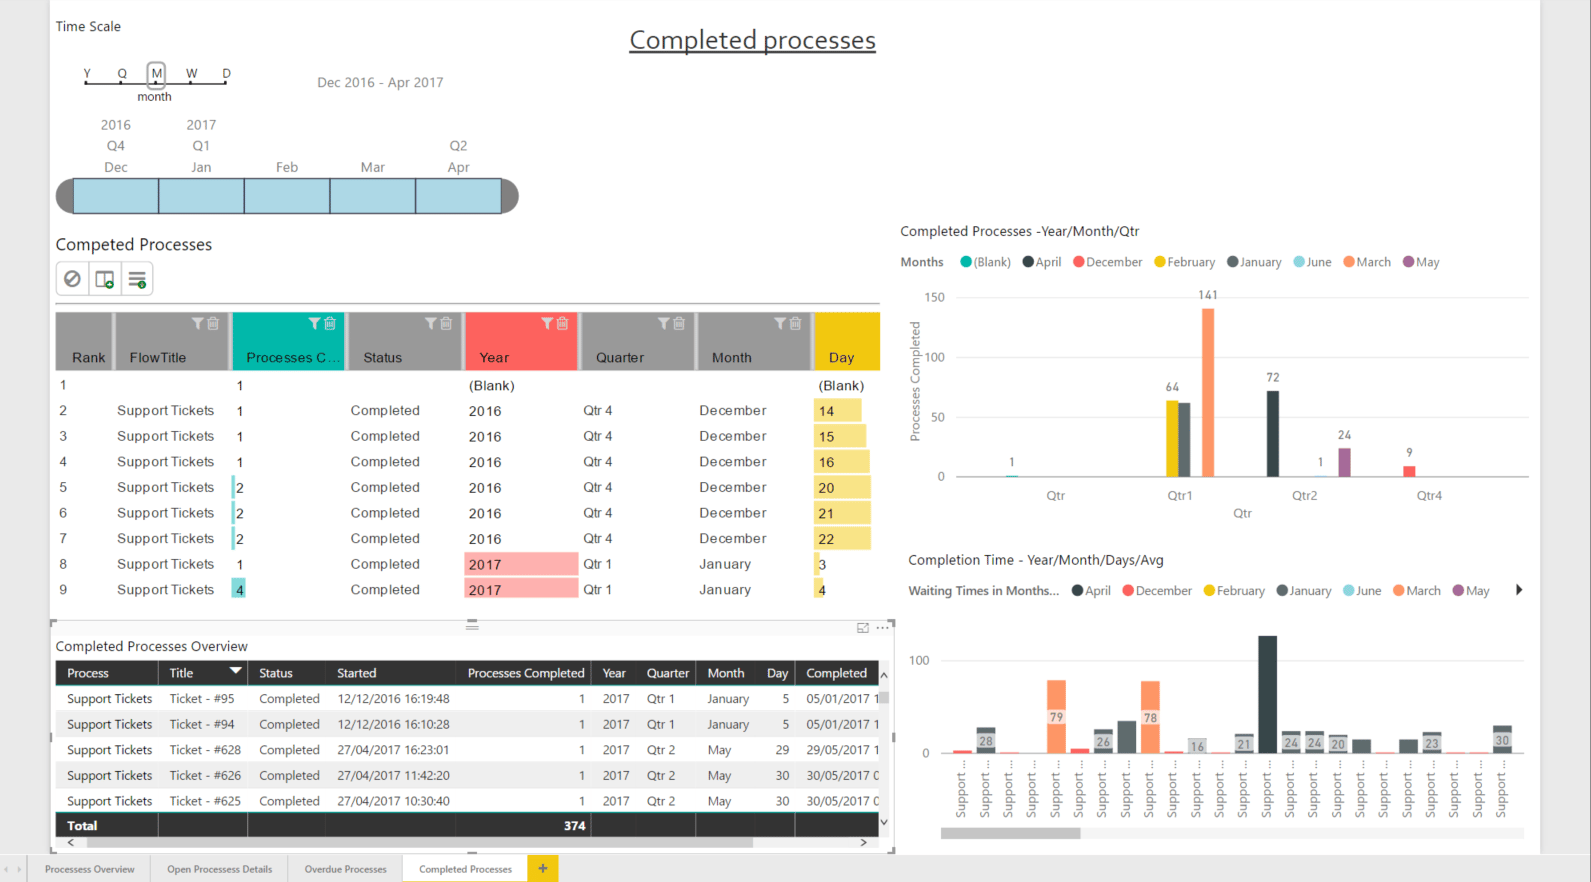
 #### Completed processes
The last category of report the content pack can produce is the completed processes dashboard, which gives an overall understanding of the completed processes, their details, and overview.
The screenshot below gives an overview of the completed processes:
* Completed processes – detailed table
* Completed by year, month, Qtr.
* Overview of each completed process
* Completion time by Year/Month, days and average.
The report is measured against a timescale, which can be a Year, Day, Week, Month, or Qtr. as selection criteria.
For example, selecting a report for the month of June filters completed processes by year, month, and Qtr. Selecting a process from the completed processes report yields its overview and completion time by day, month, and average. All the reports update dynamically based on your selection, whether by timescale or by filtering on months, days, and so on. The completion time report also shows the approximate average time taken to complete all processes in a given time scale interval.
#### Completed processes
The last category of report the content pack can produce is the completed processes dashboard, which gives an overall understanding of the completed processes, their details, and overview.
The screenshot below gives an overview of the completed processes:
* Completed processes – detailed table
* Completed by year, month, Qtr.
* Overview of each completed process
* Completion time by Year/Month, days and average.
The report is measured against a timescale, which can be a Year, Day, Week, Month, or Qtr. as selection criteria.
For example, selecting a report for the month of June filters completed processes by year, month, and Qtr. Selecting a process from the completed processes report yields its overview and completion time by day, month, and average. All the reports update dynamically based on your selection, whether by timescale or by filtering on months, days, and so on. The completion time report also shows the approximate average time taken to complete all processes in a given time scale interval.