> ## Documentation Index
> Fetch the complete documentation index at: https://docs.flowforma.com/llms.txt
> Use this file to discover all available pages before exploring further.
# Creating New Charts and Data Tables
> Create charts and data tables in FlowForma Analytics using the Create new chart icon, then pick data on the Data tab and a chart type on the Chart tab.
To create a chart, click the 'Create new chart' icon in the top-right corner of a cell on the dashboard.
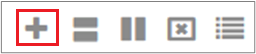 If the cell already contains a chart, you will need to click the 'Chart Tools' menu before clicking the 'Create new chart' icon. This will allow you to create a new chart from scratch and replace the one currently in that cell.
On the 'Edit chart' screen, the Data tab is displayed. This shows some of the suggested fields that can be used to create a standard Bar Chart, which is the default chart type.
If the cell already contains a chart, you will need to click the 'Chart Tools' menu before clicking the 'Create new chart' icon. This will allow you to create a new chart from scratch and replace the one currently in that cell.
On the 'Edit chart' screen, the Data tab is displayed. This shows some of the suggested fields that can be used to create a standard Bar Chart, which is the default chart type.
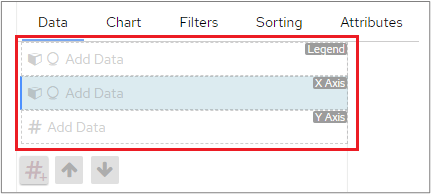 You can:
* Select the data that you want to use for a default Bar chart
* Choose the data that you want to use and then select a different type of chart on the Chart tab (note that data requirements may vary for different chart types)
* Choose the chart that you want to create on the Chart tab; this then shows you the appropriate objects for that chart type when you return to the Data tab
The order in which you perform these steps is down to personal preference. It depends on whether you know the data but are unsure of the best chart type to use, or would rather select the chart type first and then add the data.
You can:
* Select the data that you want to use for a default Bar chart
* Choose the data that you want to use and then select a different type of chart on the Chart tab (note that data requirements may vary for different chart types)
* Choose the chart that you want to create on the Chart tab; this then shows you the appropriate objects for that chart type when you return to the Data tab
The order in which you perform these steps is down to personal preference. It depends on whether you know the data but are unsure of the best chart type to use, or would rather select the chart type first and then add the data.